

NYC Voters Divided on Deportations: 42% See Negative Impact, 41% Positive
The first Emerson College Polling/PIX11/The Hill survey of the 2025 New York City Democratic Primary for mayor finds former Governor Cuomo with 33% support, while 10% support incumbent Mayor Adams, 8% former Comptroller Scott Stringer, and 6% State Senator Jessica Ramos, Comptroller Brad Lander, and State Senator Zellnor Myrie respectively; 25% are undecided. Without Cuomo on the ballot, 16% support Adams, while 12% support former Stringer and Ramos respectively, 7% support Lander, 4% support Myrie, and 34% are undecided.
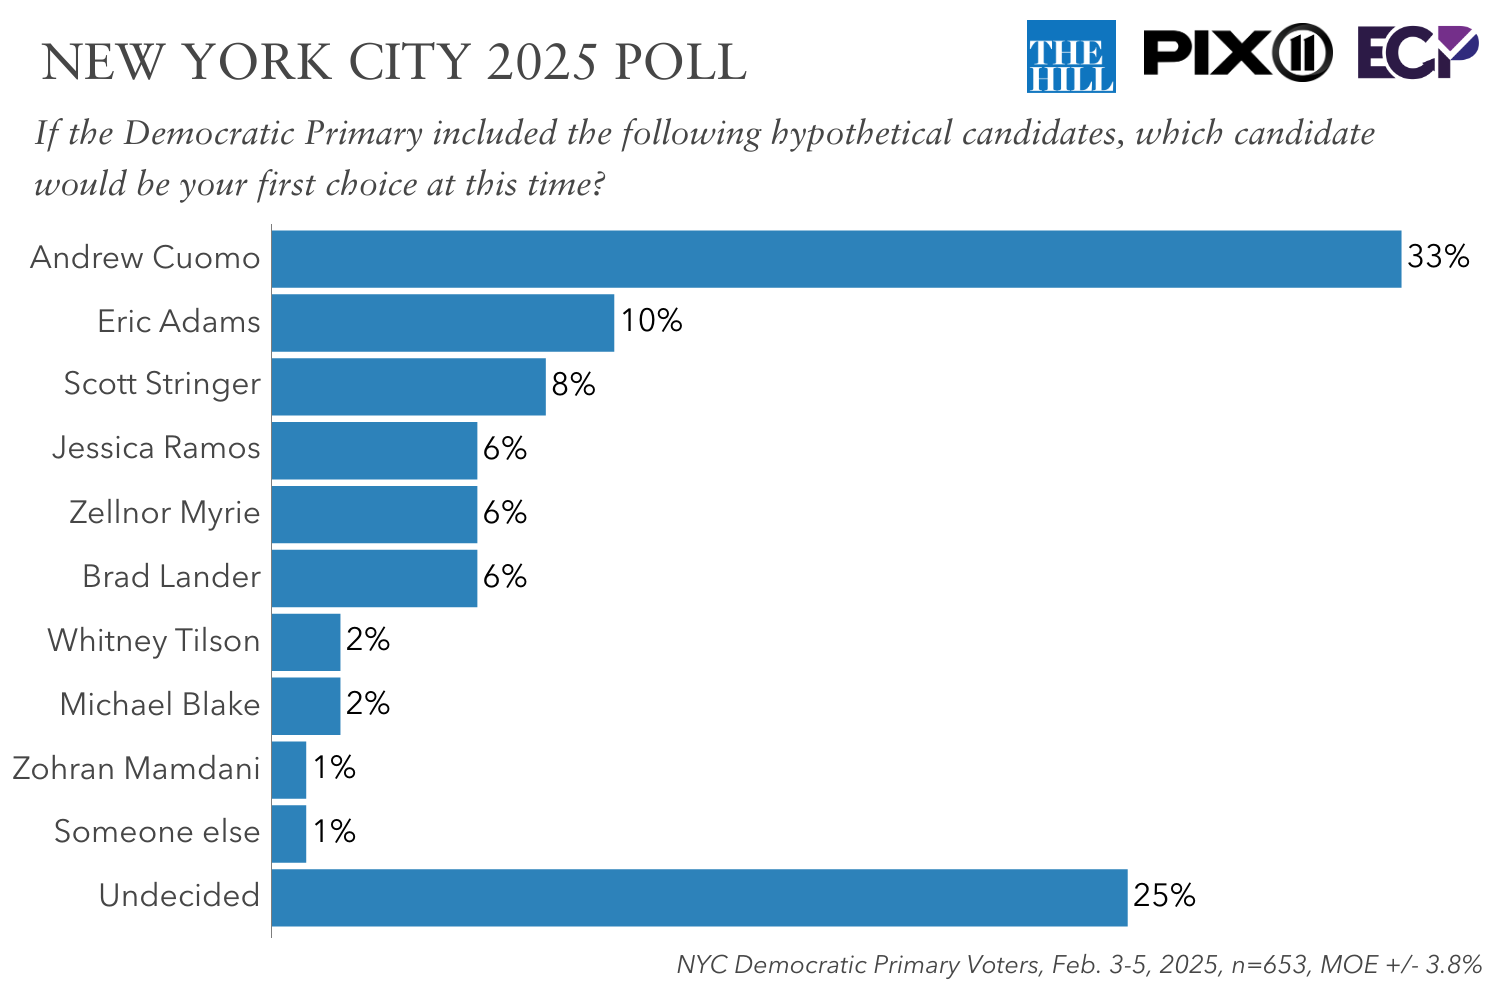
“Mayor Adams leads with Black voters at 23% with 34% undecided, but when former Governor Cuomo is on the ballot, they shift to him 35% to 13% for Adams, and undecideds drop to 24%,” Spencer Kimball, executive director of Emerson College Polling, said. “Cuomo’s high name recognition gives him an early advantage, but the race is fluid with six months to go.”
New York City holds a rank-choice mayoral election; voters were asked who their second choice at this time. Stringer and Ramos are the most popular second-choice candidates, regardless of Cuomo’s presence on the ballot. Adams sees modest second-choice gains—6% without Cuomo and 10% with him.
“Adams’ second-choice gains remain limited, regardless of Cuomo’s presence,” Kimball said. “Meanwhile, Cuomo consolidates additional support on a second round of voting, improving his chances of reaching the 50% threshold.”
Donald Trump holds a 40% favorable rating among New York City voters, while 53% have an unfavorable view of the President. Mayor Eric Adams holds a 27% favorable rating, while 58% have an unfavorable view of the Mayor. Former Governor Andrew Cuomo has a 47% favorable rating, and 37% unfavorable.
Voters have a split perception on whether mass deportations of undocumented immigrants will have a positive or negative impact on New York City: 42% think it will have a negative impact and 41% think it will have a positive impact; 17% are unsure.
“Hispanic voters think deportations will have a positive impact on the city, 47% to 33%, while white voters are split 44% positive and 44% negative, and Black voters think it will have a negative impact, 48% to 29%.”
The top issues for voters in the city include housing affordability (23%), crime (22%), economic issues (22%), and immigration (12%).
A majority of voters (55%) say they would feel unsafe riding the subway today in New York City, while 45% of voters say they would feel safe.
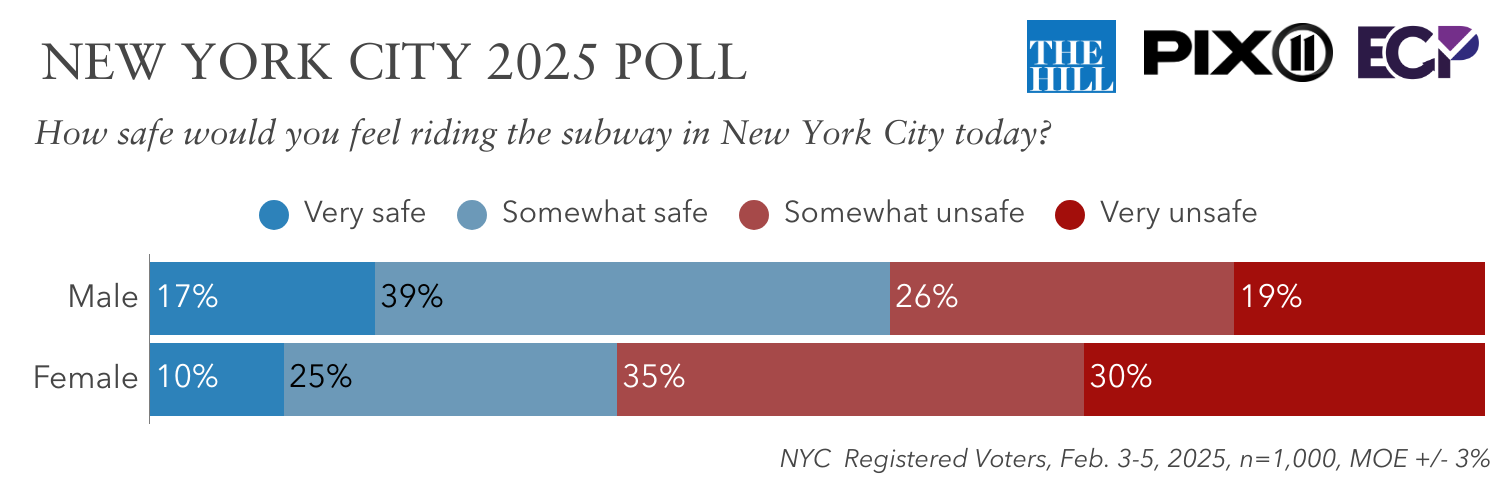
“A majority of those who ride the subway at least a few times a month feel safe riding the subway today, while majorities of those who ride the subway once a month or less frequently feel unsafe,” Kimball said. “Women are significantly more concerned than men, with 65% feeling unsafe compared to 45% of men.”
Methodology
The Emerson College Polling NYC survey was conducted February 3-5, 2025. The sample of New York registered voters, n=1,000, has a credibility interval, similar to a poll’s margin of error (MOE), of +/- 3 percentage points. The sample of Democratic Primary voters includes n=653, with a credibility interval of +/-3.8%. The data sets were weighted by gender, education, race, age, party registration, and region.
It is important to remember that subsets based on demographics, such as gender, age, education, and race/ethnicity, carry with them higher credibility intervals, as the sample size is reduced. Survey results should be understood within the poll’s range of scores, and with a confidence interval of 95% a poll will fall outside the range of scores 1 in 20 times.
Data was collected by contacting cell phones via MMS-to-web text (phone list provided by Aristotle), and an online panel of voters provided by CINT. Panel responses were matched to the Aristotle voter file using respondents’ full name and ZIP code; responses that were not matched to a unique NYC voter were removed from the final data set. The survey was offered in English.
All questions asked in this survey with the exact wording and ordering, along with full results, demographics, and cross tabulations can be found under Full Results. This survey was funded by Emerson College/Nexstar Media.


