

Voters Oppose US Expansion in Canada, Greenland, Gaza Strip
A new Emerson College Polling national survey of US voters finds President Trump with a 48% job approval rating, and 42% disapproval. Since January, Trump’s approval has decreased by one point and his disapproval has increased by one point. The survey measured approval of the job Elon Musk is doing at the Department of Government Efficiency (DOGE). Forty-five percent disapprove of the job he is doing, while 41% approve; 14% are neutral.
“The poll findings suggest generally unpopular domestic and foreign policy ideas, however, Trump’s approval has not shifted significantly since last month,” Spencer Kimball, executive director of Emerson College Polling, said.
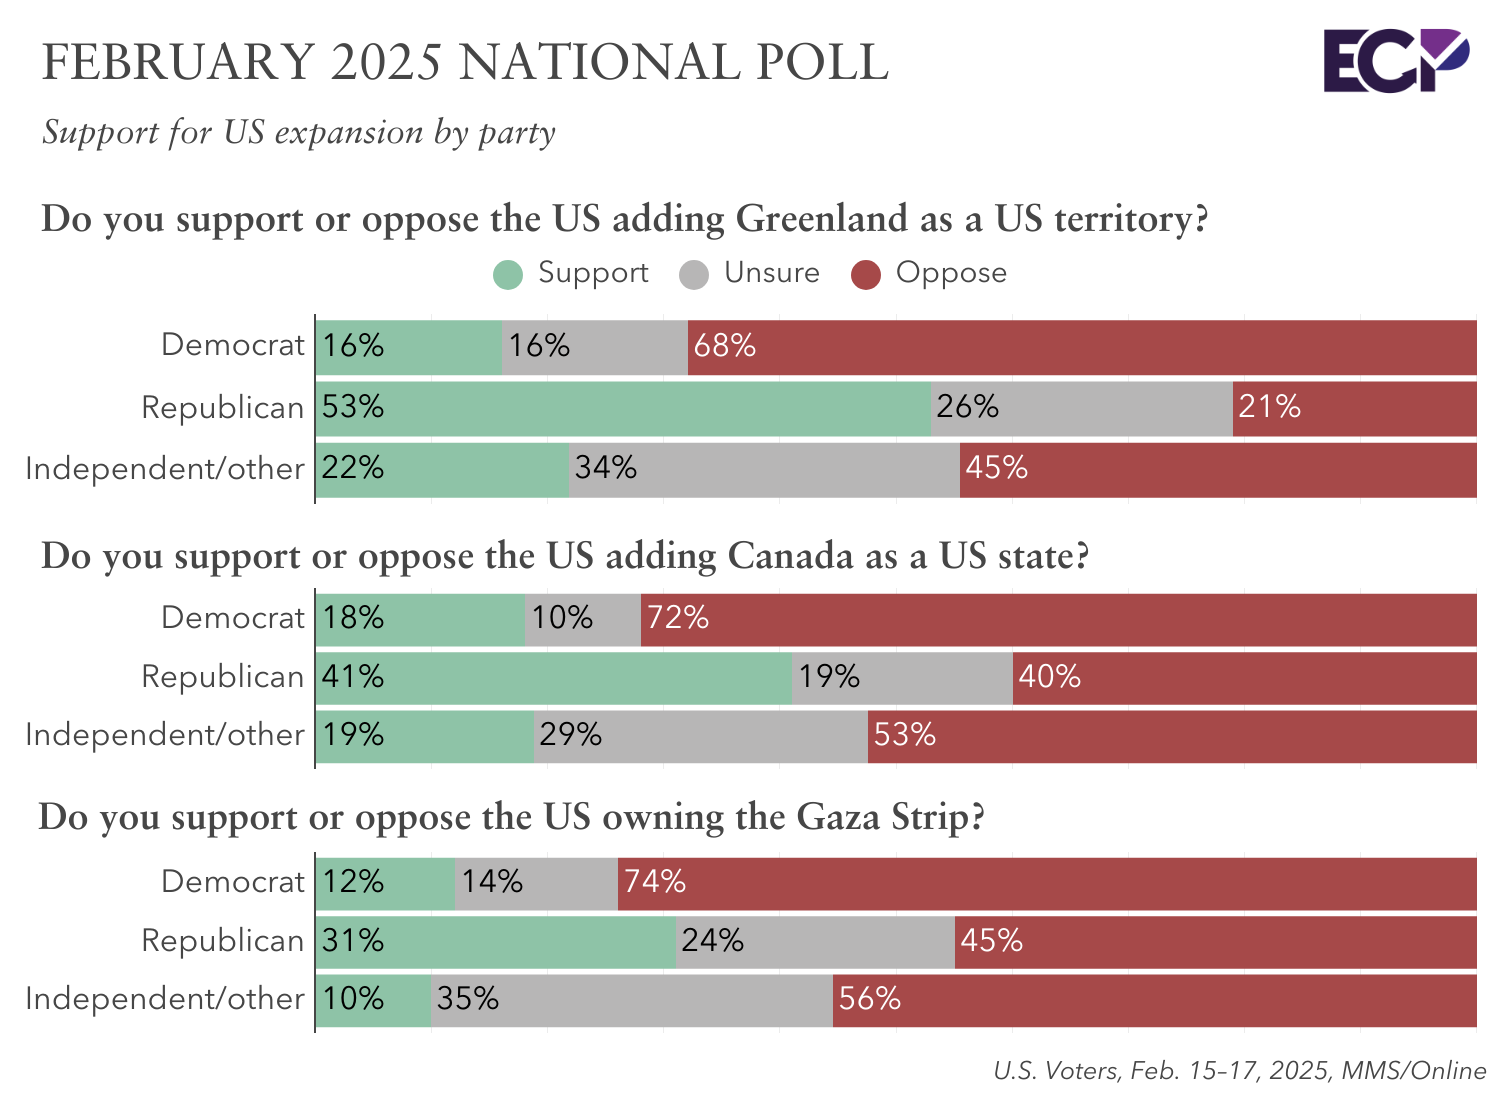
Voters oppose the US owning the Gaza Strip, 58% to 18%, the US adding Canada as a state 55% to 26%, and Greenland as a US territory 44% to 30%.
Support for changes to US states and territories varies by party:
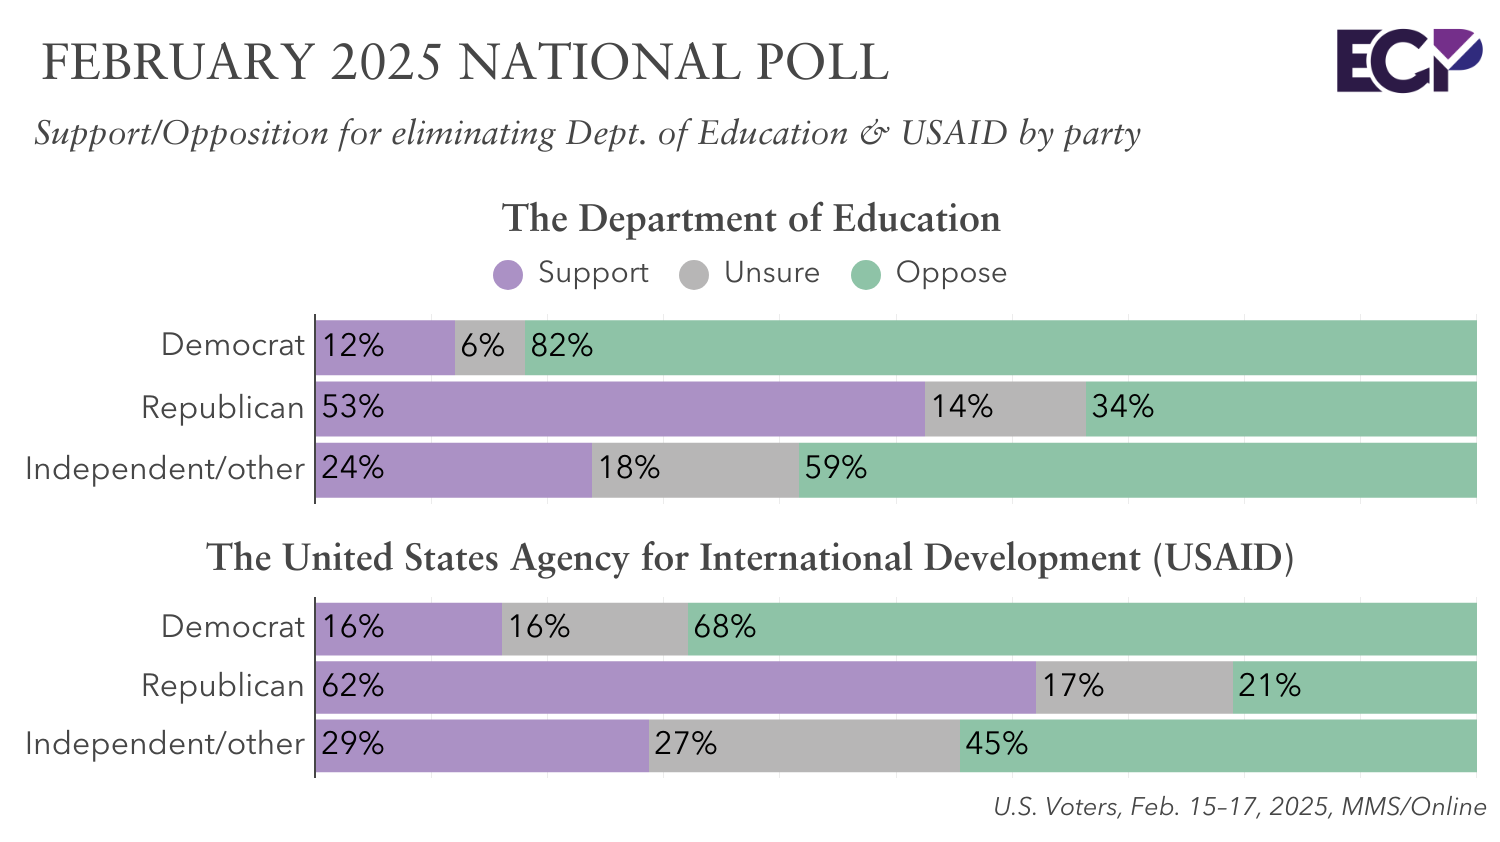
Regarding the elimination of the US Agency for International Development (USAID), 44% oppose its elimination, while 36% support the decision to eliminate it; 20% are unsure. Voters more strongly oppose the elimination of the Department of Education: 58% oppose, while 30% support its elimination.
“Support for eliminating the Department of Education is found among Republicans, at 53%, while Democrats and independents strongly oppose it at 82% and 59%,” Kimball said. “Eliminating USAID is popular among Republicans, at 62% support, but less popular among Democrats and independent voters, at 68% and 45% opposition.”
Voters are divided on the impact of tariffs on the US job market: 39% think they create American jobs, 39% think they eliminate jobs, and 22% think they have no impact on jobs.
“A majority of Republicans think tariffs help create American jobs at 65%, while a majority of Democrats think tariffs eliminate American jobs at 61%,” Kimball added. “Independents think they eliminate jobs 39% to 31%.”
Voters were asked which of the following viewpoints on cryptocurrency better reflects their view: if it is a legitimate form of currency, or if it is a scam. A majority (57%) think it is a scam, while 43% think it is a legitimate form of currency.
“Men are more split on crypto: 52% think it is more of a scam and 48% think it is a legitimate form of currency, while 62% of women think it is more of a scam than a legitimate form of currency,” Kimball said.
- While a majority of all education groups agree more that crypto is a scam rather than a legitimate form of currency, those with postgraduate degrees most strongly think it is a scam at 66%.
- Voters over 70 are most likely to view crypto as more of a scam, at 75%, compared to the majority of voters under 50 (55%) who view it as more of a legitimate form of currency.
A majority of voters (54%) think not anyone should be able to create or issue cryptocurrencies, while 18% think anyone should be able to.
Regarding how much rising or falling egg prices influence voters perception of the state of the economy, 23% say they influence them a great deal, 25% a fair amount, 26% only a little, and 23% not at all.
A plurality of voters (46%) support Trump’s executive order that would discontinue production of the penny, while 29% oppose it and 25% are unsure. Support is split on whether or not the penny should be totally eliminated from general circulation: 38% support the total elimination of pennies from circulation while 37% oppose it. A quarter (25%) are unsure.
Thinking back to last week’s Super Bowl advertisements, 7% of voters recall the Budweiser advertisement as their favorite commercial, 3% recall the Doritos commercial as their favorite, 3% Dunkin Donuts, 2% Mountain Dew, and 2% Nike. Forty-five percent of voters have no favorite.
Methodology
The Emerson College Polling national survey was conducted February 15-17, 2025. The sample of US registered voters, n=1,000, has a credibility interval, similar to a poll’s margin of error (MOE), of +/- 3 percentage points. The data sets were weighted by gender, education, race, age, party registration, and region.
It is important to remember that subsets based on demographics, such as gender, age, education, and race/ethnicity, carry with them higher credibility intervals, as the sample size is reduced. Survey results should be understood within the poll’s range of scores, and with a confidence interval of 95% a poll will fall outside the range of scores 1 in 20 times.
Data was collected by contacting cell phones via MMS-to-web text (phone list provided by Aristotle), and an online panel of voters provided by Rep Data. Panel responses were matched to the Aristotle voter file using respondents’ full name and ZIP code. The survey was offered in English.
All questions asked in this survey with the exact wording, along with full results, demographics, and cross tabulations can be found under Full Results. This survey was funded by Emerson College.


