

68% of Voters Think Birthright Citizenship Should Continue
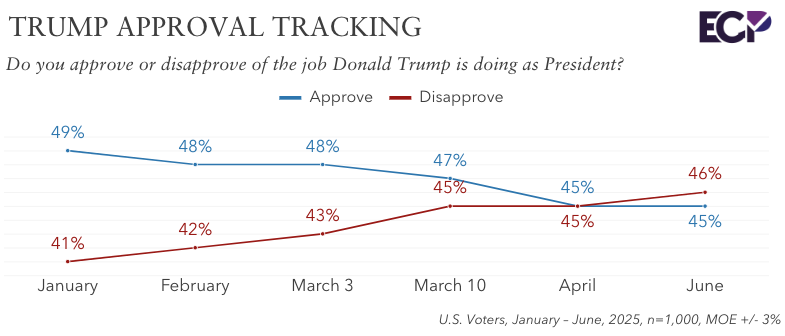
A new Emerson College Polling survey of U.S. voters finds President Donald Trump with a 45% approval rating, and 46% disapproval. Since the 100-day Emerson poll, Trump’s approval remained at 45%, while his disapproval increased from 45% to 46%. A majority of voters (52%) say things in the United States are generally on the wrong track, while 48% think things are headed in the right direction.
On the generic 2026 congressional ballot, 43% of voters plan to support the Democratic candidate, while 40% support the Republican candidate. Eighteen percent are undecided.
“Looking ahead to next year’s Midterm Election, the Democrats have a slight edge over the Republicans, with independents breaking for the Democratic candidate 37% to 27%,” Spencer Kimball, executive director of Emerson College Polling, said. “However, a significant 36% of independents are undecided, so this number is expected to shift.”
2028 Presidential Election
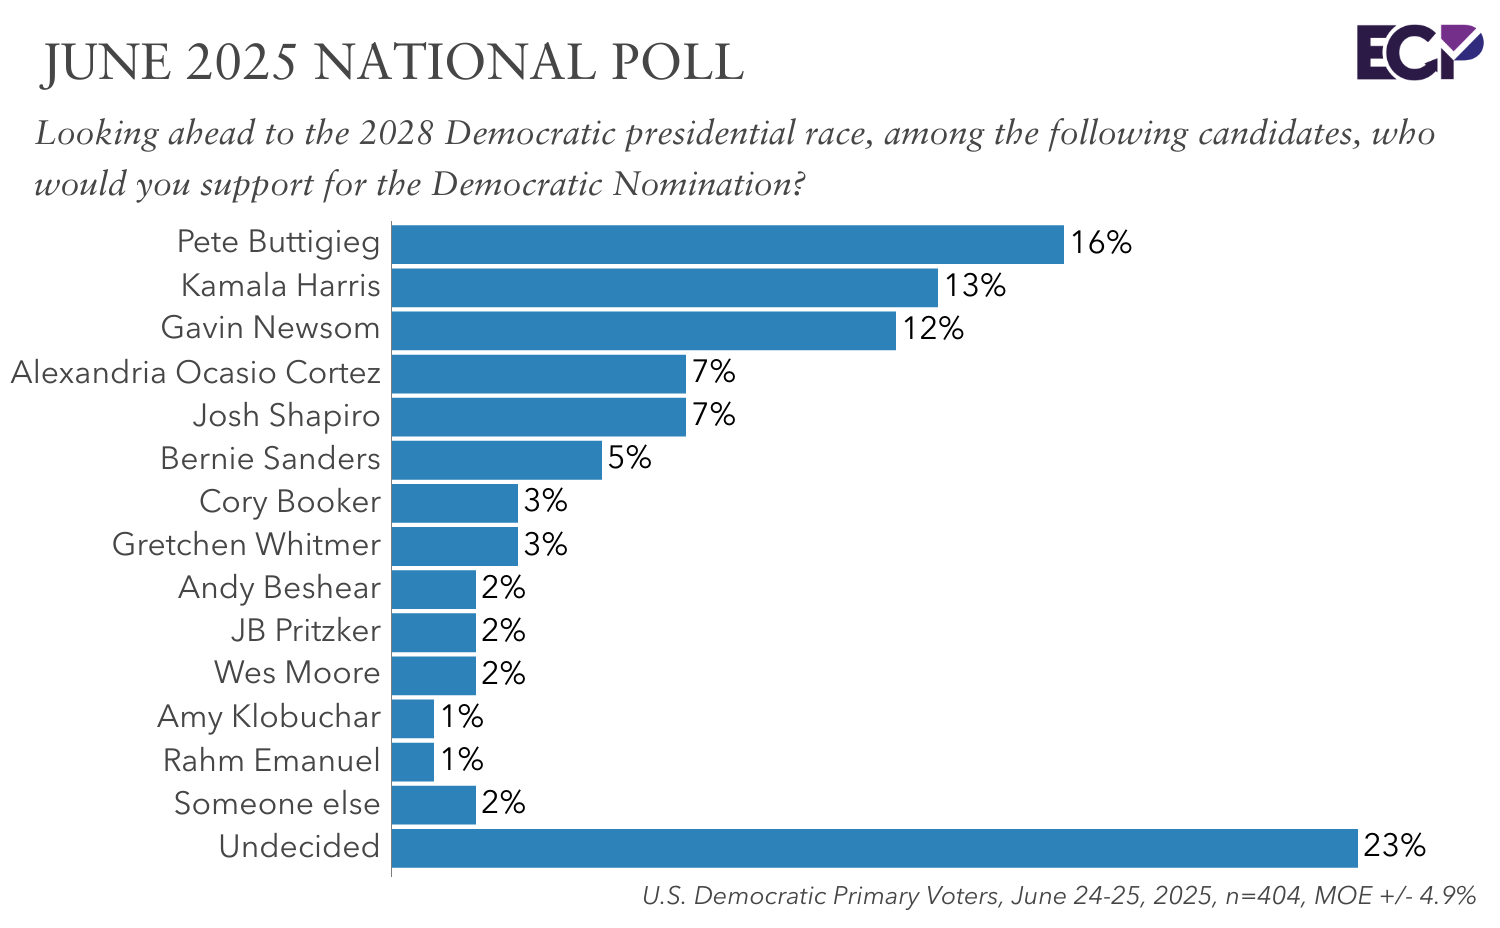
In the 2028 Democratic presidential primary, 16% support former Secretary of Transportation Pete Buttigieg, 13% former Vice President Kamala Harris, 12% California Governor Gavin Newsom, 7% Pennsylvania Governor Josh Shapiro and Representative Alexandria Ocasio-Cortez respectively, 5% Vermont Senator Bernie Sanders, and 3% New Jersey Senator Cory Booker. Twenty-three percent are undecided.
The November Emerson poll on the 2028 primary allowed voters to write in their preferred candidate. Harris received 37% support, Newsom 7%, Buttigieg 4%, Shapiro 3%, and Whitmer 3%.
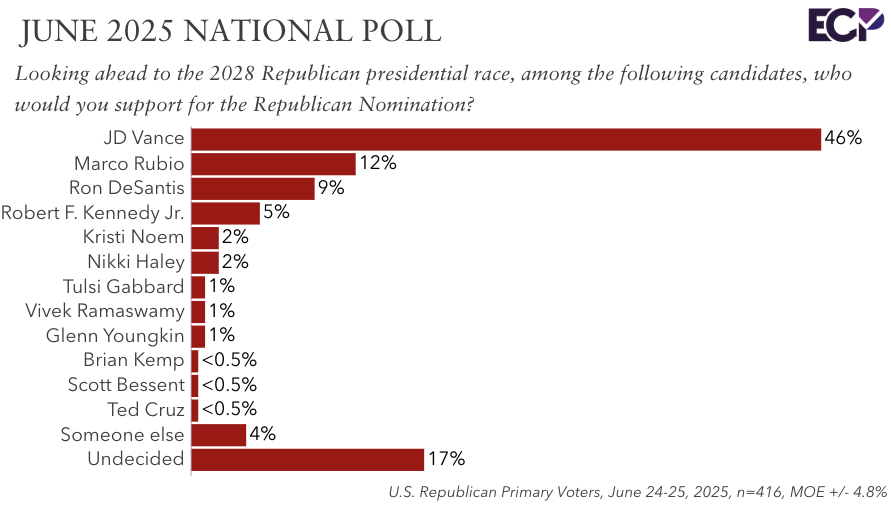
A plurality of Republican presidential primary voters (46%) support Vice President JD Vance in a hypothetical 2028 ballot test, while 12% support Florida Senator Marco Rubio, 9% support Florida Governor Ron DeSantis, and 5% support Health and Human Services Secretary Robert F. Kennedy Jr.
In November, Vance received 30% support, DeSantis 5%, Kennedy Jr. 2%, and Rubio 1%.
“Vice President Vance has solidified himself as the frontrunner in the 2028 nomination contest, backed by 52% of male Republican primary voters and voters over 60,” Kimball added.
On a generic 2028 presidential ballot test, 42% would support the generic Democratic candidate, 42% the Republican, and 16% are undecided.
“Similarly to the generic congressional ballot, independents break for the generic Democrat on the presidential ballot, 37% to 29%, with a significant 34% undecided,” Kimball noted.
The economy remains the top issue for voters at 32%, down from 41% in March. Threats to democracy are the top concern for 22% of voters, a four-point increase. Immigration follows at 14%, healthcare at 9%, housing affordability at 7%, and crime at 5%.
Immigration
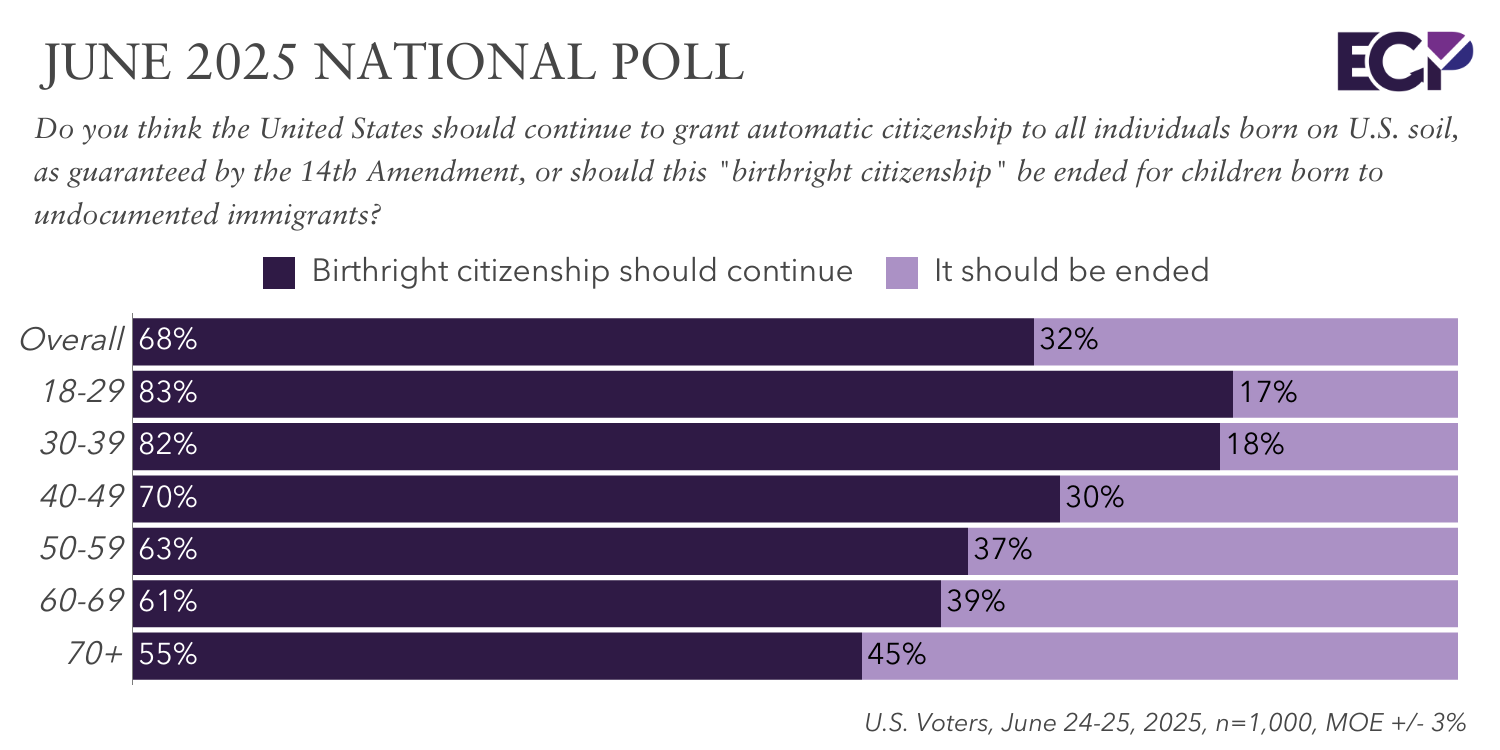
A majority of voters (68%) think birthright citizenship should continue for all born in the United States, while 32% of voters think it should be ended for children of undocumented immigrants.
“Support for birthright citizenship policy is highest among voters under 30, at 83%, and lowers steadily as voters’ age increases, to 55% of voters over 70,” Kimball added.
- A majority of Democrats (90%) and independent voters (66%) think birthright citizenship should continue for everyone. Republicans are more split: 51% think it should be ended for children of undocumented immigrants and 49% think it should continue.
Regarding deportations, 52% think the Trump administration has gone too far, while 25% think they have been about right, and 23% think they have not gone far enough.
Perception of Truthfulness
Voters were asked if they believe the Trump administration and news media have been generally truthful or generally untruthful, a question asked in a 2017 Emerson poll. The Trump administration is viewed as being truthful by 40%, while 46% think the administration is untruthful; 14% are unsure. The “news media” is viewed as truthful by 29%, while 48% view it as untruthful, and 24% are unsure.
Compared to the first month of Trump’s first term, in February 2017, 49% perceived the Trump administration as truthful and 48% untruthful, and the news media 39% truthful and 53% untruthful.
Foreign Affairs
Fifty-seven percent of voters think it is likely that a world war breaks out in the next four years, while 43% think it is not likely. This is a two-point increase in perception of likelihood since the March Emerson national poll, following the Zelensky Oval Office meeting.
Voters were asked which is more likely: Israel and Iran achieving peace in the next few weeks, or entering a major war in the next few weeks. Thirty percent think they will be in a major war, 28% think they will achieve peace, and 42% are unsure.
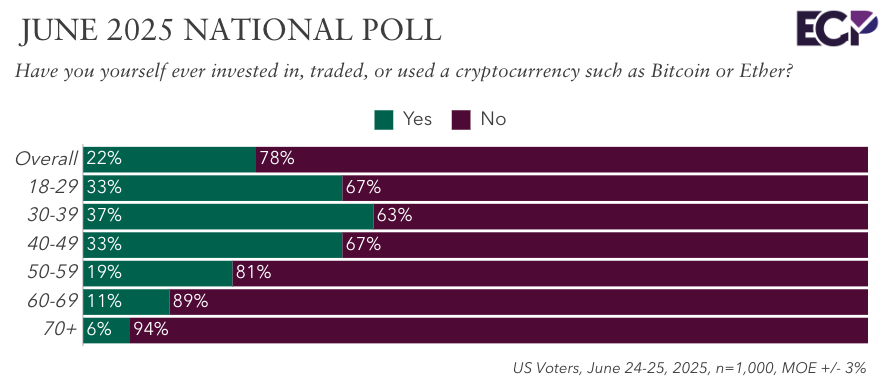
Cryptocurrency
Twenty-two percent of voters say they have invested, traded, or used a cryptocurrency, while 78% have not. Since December 2024, the share of voters who say they use crypto increased by three percentage points from 19% to 22%.
Fourth of July
Voters were asked if the Trump presidency has strengthened their feelings of patriotism, weakened them, or had no effect. It has strengthened feelings of patriotism for 39%, had no effect for 34%, and weakened for 27%.
- Two-thirds (67%) of Republicans say the Trump presidency has strengthened their feelings of patriotism, while 45% of Democrats say it has weakened them. Independents are more divided, with 31% reporting it has strengthened them, 30% weakened, and 39% no effect.
Thinking about summer vacation plans and spending, 41% plan to spend less money than last year on vacation, 40% about the same, and 19% plan to spend more money on vacation.
- Thirty-six percent of voters under 30 plan to spend more on vacations this summer, compared to 23% of voters in their 30s and 40s, and 12% of voters over 50.
Watch Emerson College Polling Executive Director Spencer Kimball break down results on Nexstar Media’s Political Power Ranker with Nexstar Director of Political Content Chris Berg
Methodology
The Emerson College Polling national survey was conducted June 24-25, 2025. The sample of U.S. active registered voters, n=1,000, has a credibility interval, similar to a poll’s margin of error (MOE), of +/- 3 percentage points. The data sets were weighted by gender, education, race, age, party registration, and region based on U.S. Census parameters and voter file data.
It is important to remember that subsets based on demographics, such as gender, age, education, and race/ethnicity, carry with them higher credibility intervals, as the sample size is reduced. Survey results should be understood within the poll’s range of scores, and with a confidence interval of 95% a poll will fall outside the range of scores 1 in 20 times.
Data was collected by contacting a voter list of cellphones via MMS-to-web text (list provided by Aristotle) and an online panel of voters provided by CINT. Panel responses were matched to the Aristotle voter file using respondents’ full name and ZIP code. The survey was offered in English.
All questions asked in this survey with the exact wording, along with full results, demographics, and cross tabulations can be found under Full Results. This survey was funded by Emerson College.


