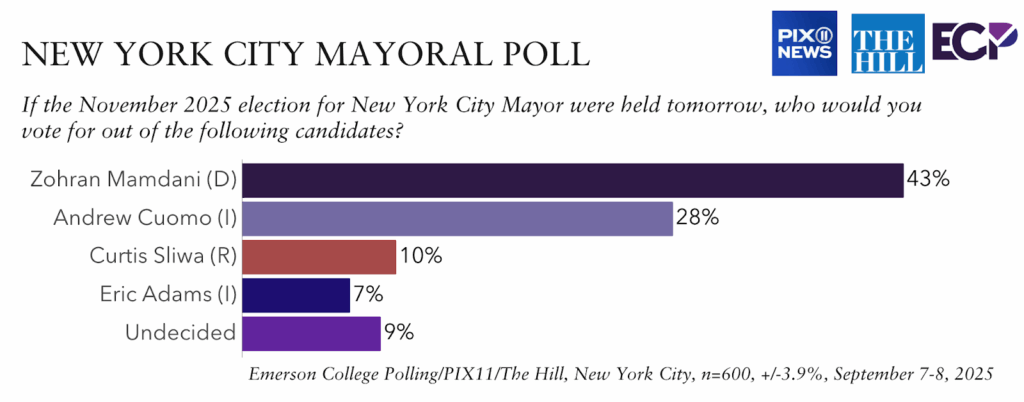
A new Emerson College Polling/PIX11/The Hill survey of New York City voters finds Democratic nominee Zohran Mamdani with 43% support in the November election for Mayor, while 28% support former Governor and independent candidate Andrew Cuomo, 10% support Republican nominee Curtis Sliwa, and 7% support incumbent Mayor Eric Adams for re-election. Nine percent are undecided.

“In Emerson’s first general election poll of the New York City mayoral election, Mamdani starts with a 15-point lead over former Governor Andrew Cuomo,” Spencer Kimball, executive director of Emerson College Polling, said. “Mamdani has a 29-point lead over Cuomo among voters under 50, leading 49% to 20%, and that lead tightens to six points among voters over 50, leading 39% to 33%.”
Those who say they are “very likely” to vote in the November election break for Mamdani by 46% to 27%, while those who are “somewhat likely” to vote break for Cuomo, 34% to 27%.
Seventy-seven percent of voters say they will definitely vote for the candidate they chose, while 23% think there is a chance they could change their mind and vote for someone else. Mamdani voters are most locked in on their candidate: 85% will “definitely” support him, compared to 74% of Sliwa voters, 72% of Cuomo voters, and 66% of Adams voters.
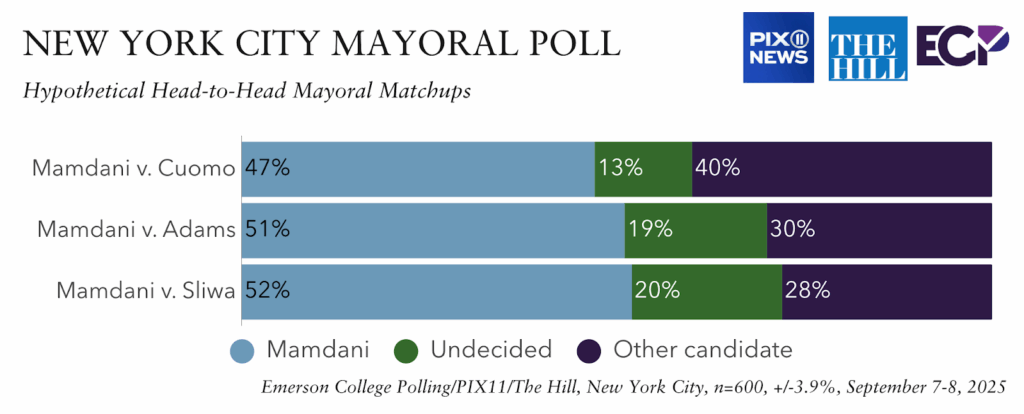
Several head-to-heads were also tested. In a matchup with just Mamdani and Cuomo, 47% support Mamdani and 40% Cuomo; 13% are undecided. Against Sliwa, Mamdani leads 52% to 28%, with 20% undecided. Against Adams, 51% support Mamdani and 30% Adams; 19% are undecided.

Mamdani has the most favorable name recognition among the candidates: 48% have a favorable view of him, while 34% have an unfavorable view of Mamdani. Cuomo holds a 36% favorability rating, while 51% view the former Governor unfavorably. Mayor Adams has a 26% favorable rating among his constituents, while 61% have an unfavorable view of the Mayor. Donald Trump has a 31% favorable rating in the city, while 64% have an unfavorable view of the President.

A plurality (42%) think their community safety is no different now than it was four years ago, while 39% think their community is less safe, and 19% think it is more safe. This question was also asked to Boston voters ahead of the city’s Mayoral preliminary election; 45% think their community in Boston is more safe, 21% less safe, and 35% no different.

Two-thirds of New York voters (66%) support a two percent tax on those earning above $1 million annually, while 18% oppose. Mamdani voters support a two percent tax 81% to 5%, while Cuomo voters support a two percent tax 56% to 30%.
Forty-three percent of New York City voters say their family’s finances are worse off than a year ago, while 41% think they are about the same. Seventeen percent say they are better off. Compared to May 2025, those who say they are worse off have decreased by six percentage points, while those who are about the same have increased by six.
New York City voters think the economy (27%) and threats to democracy (25%) are the top issues facing the United States, followed by healthcare (11%), crime (11%), housing affordability (9%), and immigration (6%).
Methodology
The Emerson College Polling/PIX11/The Hill New York City survey was conducted September 7-8, 2025. The sample of New York City active voters, n=600, has a credibility interval, similar to a poll’s margin of error (MOE), of +/- 3.9 percentage points. The data sets were weighted by gender, education, race, age, party registration, and region based on 2025 voter turnout modeling based on voter file data.
It is important to remember that subsets based on demographics, such as gender, age, education, and race/ethnicity, carry with them higher credibility intervals, as the sample size is reduced. Survey results should be understood within the poll’s range of scores, and with a confidence interval of 95% a poll will fall outside the range of scores 1 in 20 times.
Data was collected by contacting cell phones via MMS-to-web text (n=383) and landlines via Interactive Voice Response (n=53) (voter list provided by Aristotle), along with an online panel of voters provided by CINT (n=163); panel responses were matched to the Aristotle voter file using respondents’ full name and ZIP code; responses that were not matched to a unique NYC voter were removed from the final data set. The survey was offered in English.
All questions asked in this survey with the exact wording and ordering, along with full results, demographics, and cross tabulations can be found under Full Results. This survey was funded by Nexstar Media.


