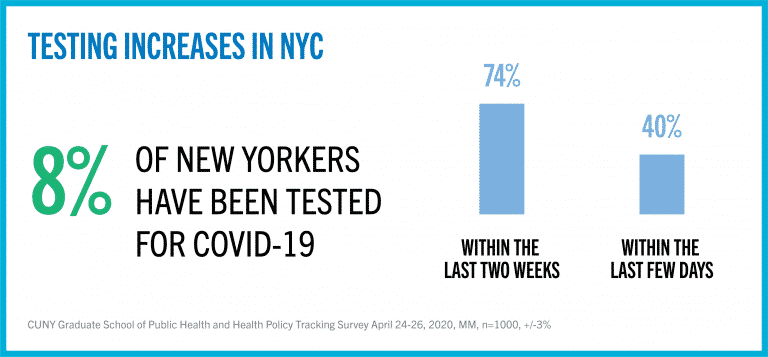
Coronavirus testing geared up in New York over the past week, but only 8% of our 1000 NYC survey respondents reported they had been tested to date. The great majority of these people (74%) said their test took place over the last two weeks and 40% mentioned that it took place just “within the last few days.” These findings are part of the seventh weekly city and statewide tracking survey from the CUNY Graduate School of Public Health & Health Policy (CUNY SPH) conducted April 24-26.

A number of the questions on the CUNY survey asked respondents to answer on behalf of everyone in their household, which included 2,772* men, women, and children. Among this household cohort, the test rate was 5.7% and close to half tested positive. Sixty percent (60%) of respondents who tested positive believe they were exposed at home.
Although new hospital admissions are reportedly trending down in NYC, 20% of our respondents reported someone is or was sick with coronavirus symptoms. For the entire household cohort, 480 people (17%) have been sick at home with coronavirus symptoms.
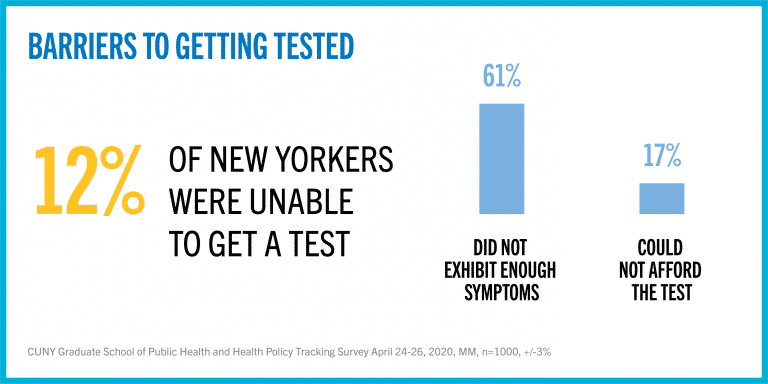
More than one in eight respondents (12%) said they were unable to get tested for coronavirus by a healthcare professional. Of this group, 61% said they were told that they did not exhibit enough symptoms and 17% reported not being able to pay for the test.

The increased demand for testing may be based on what respondents experience daily. More than a third of them (36%) said they knew someone who has died from COVID-19. That percentage was highest among Hispanics (44%), followed by whites (36%), African Americans (35%) and Asians (21%).
“The recent increase in COVID-19 testing is encouraging, but the focus remains on people who are symptomatic,” said Dr. Ayman El-Mohandes, Dean of CUNY SPH. “As we plan to return to less restricted daily activities and restore more business operations successfully, testing must become widely available, routine, and not selective.”
Economic issues: Assistance on the Upswing?
More than one in eight (13%) New Yorkers reported losing their health insurance since the epidemic started. Racial and ethnic differences were considerable. Latinos (23%) and African Americans (14%) were more likely to have lost their health insurance, compared to just 6% of Asians (6%) and whites (6%).

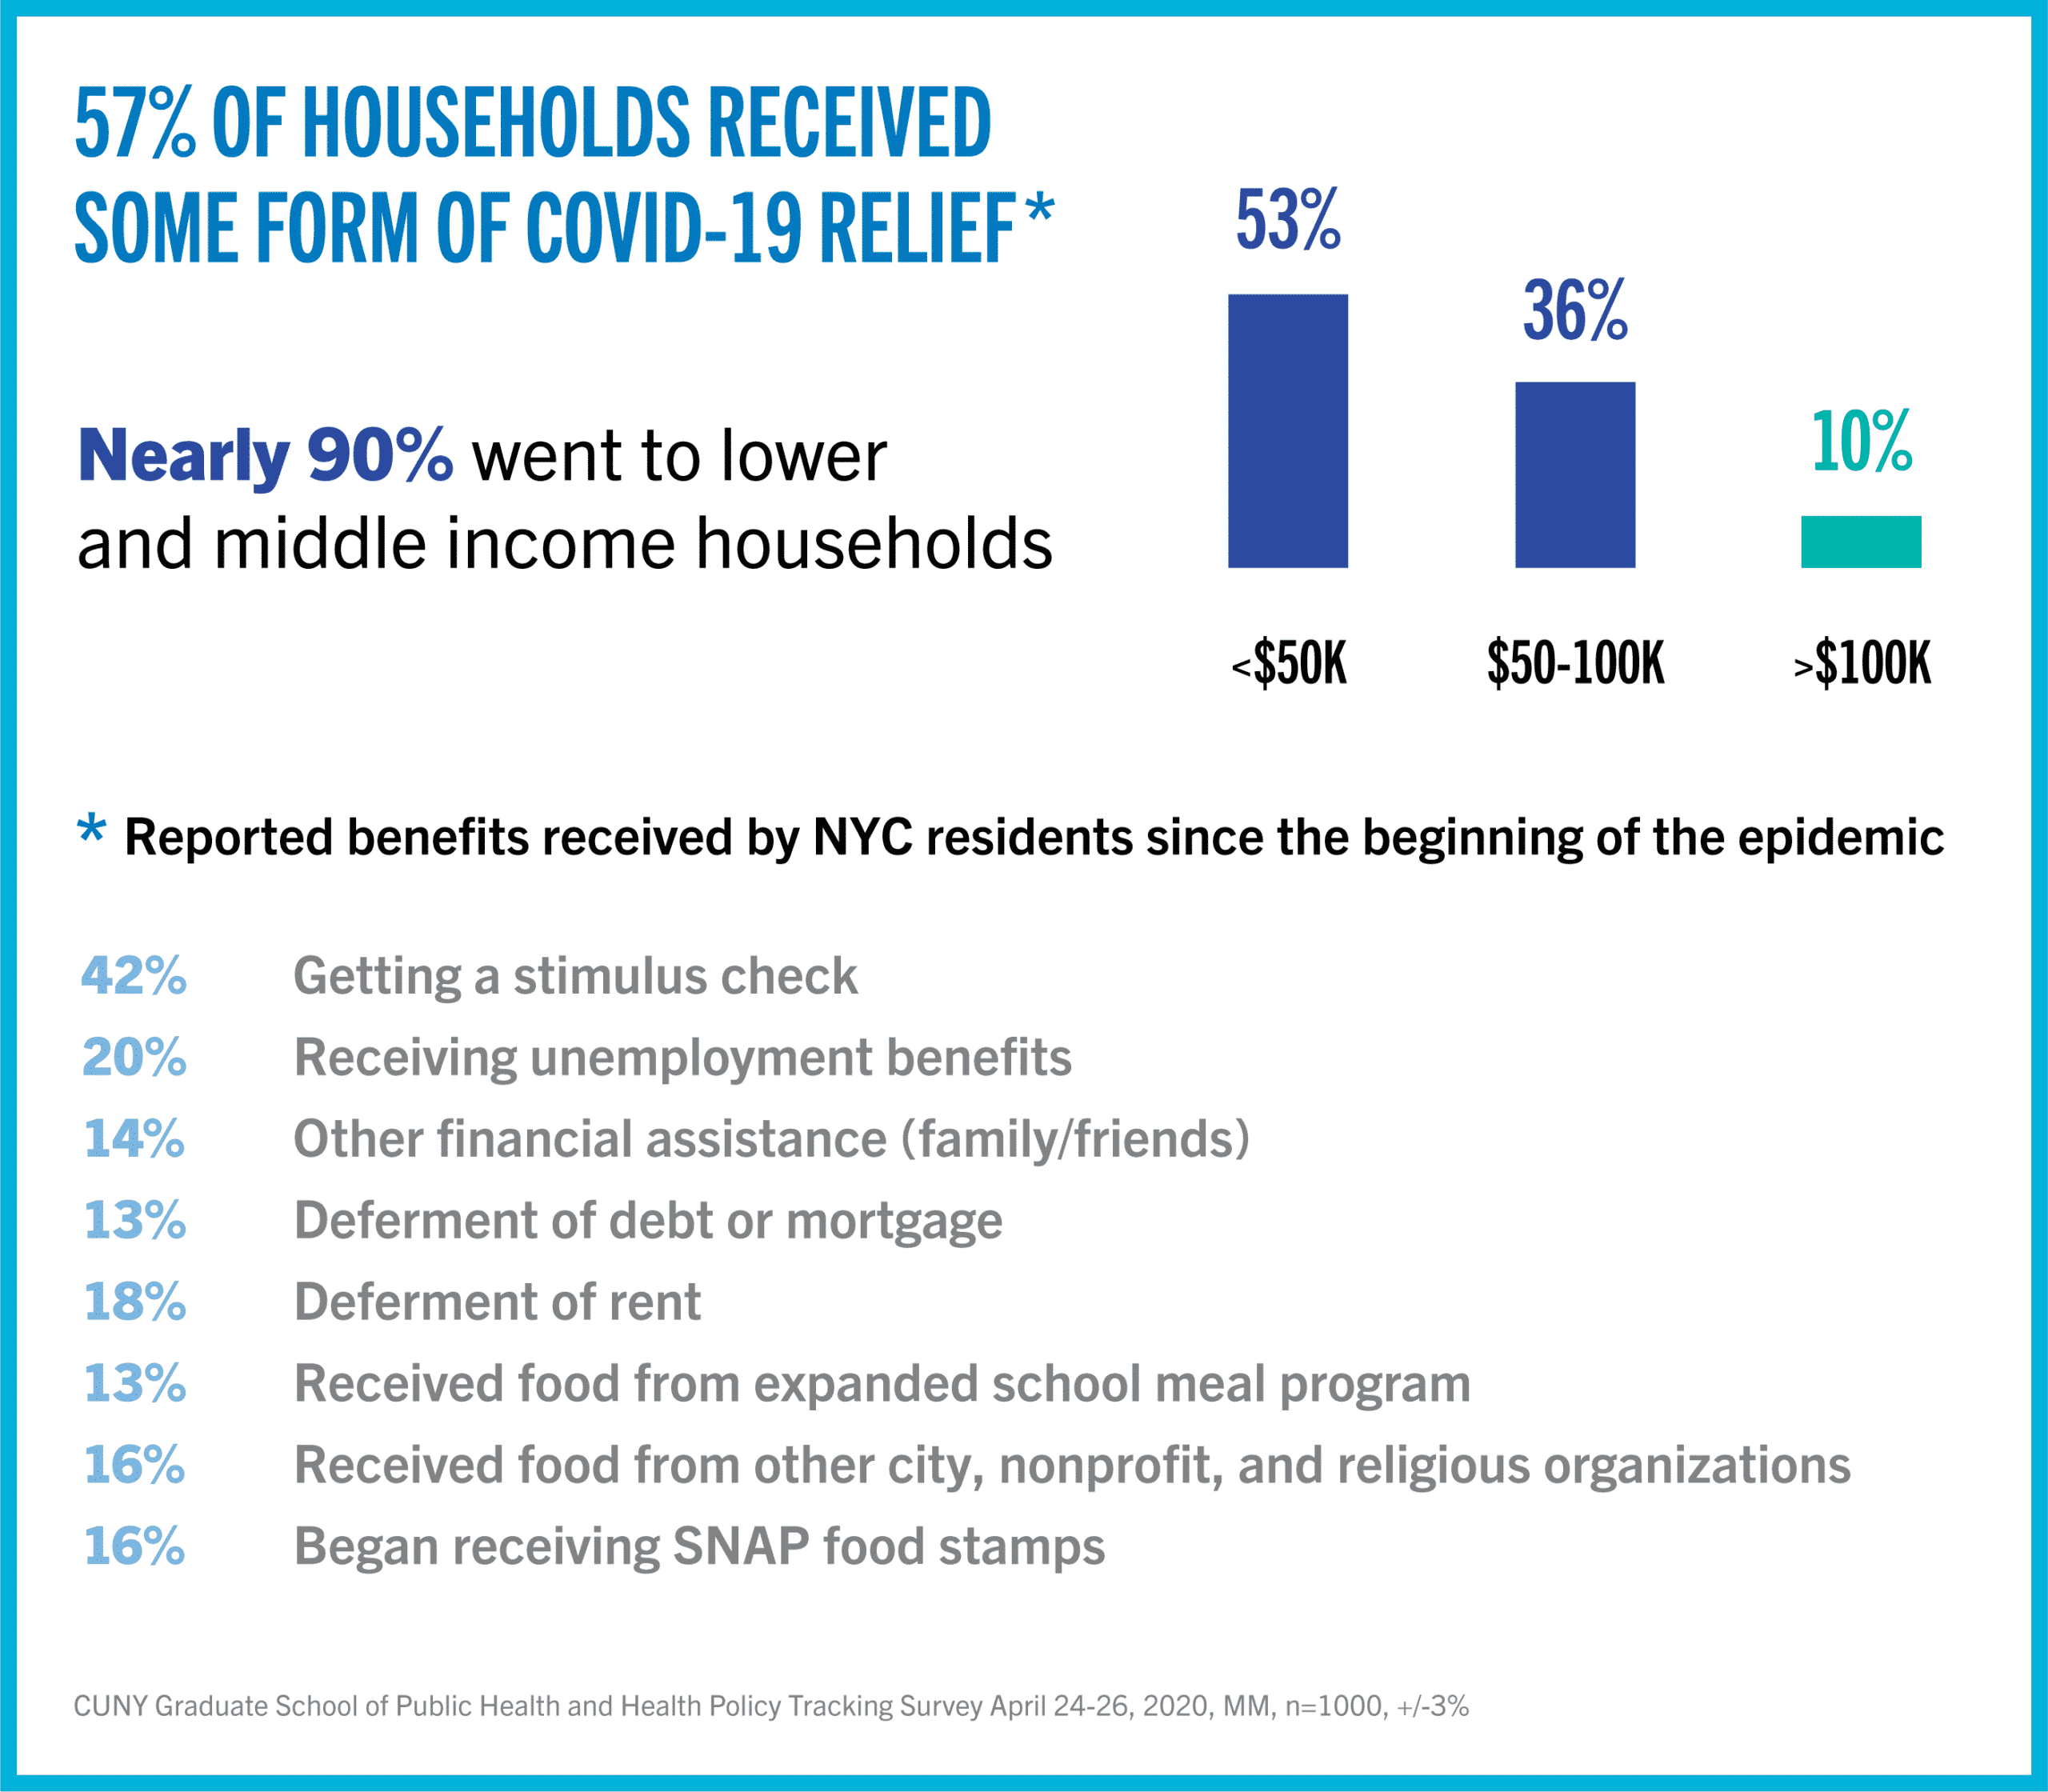
New Yorkers did report receiving a wide range of public and private, financial and in-kind assistance since the beginning of the coronavirus outbreak. Of the 57% of respondents who received some form of benefits or relief, 89% were from lower- and middle-income groups and the majority were lower income, showing the cross-cutting impact of the epidemic and the reach of assistance programs.
Benefits received by NYC residents since the beginning of the epidemic:
- 42% stimulus check
- 20% unemployment benefits
- 14% other financial assistance (family and friends)
- 13% deferment of debt or mortgage
- 18% deferment of rent
- 13% food from expanded school meal program
- 16% food from other city, nonprofit, and religious organizations
- 16% began receiving SNAP (food stamps)
“Fortunately, many New Yorkers are using newly expanded public programs to reduce hunger and food insecurity, mitigating one of the most serious immediate consequences of the epidemic’s economic and social disruptions,” said Nicholas Freudenberg, Distinguished Professor of Public Health at CUNY SPH and Director of its Urban Food Policy Institute.
Signs of Resistance to a Coronavirus Vaccine?
Although many scientists and public health authorities have stated that a coronavirus vaccine is the only way to assure protection against COVID-19, a substantial minority of New Yorkers seem not enthusiastic about it. While a majority (59%) of respondents said that they would get a vaccine if it became available, still fewer (53%) said they would give it to their children. Moreover, only 31% expressed interest in volunteering for a clinical trial of a potential coronavirus vaccine, with wide variation across ethnic and racial groups (47% Asian, 36% white, 26% Latinx/Hispanic, 22% African American).

Potential vaccine acceptance varies by perception of risk of infection. Of those who believe they are at higher risk of illness, substantially more (68%) are willing to be vaccinated, compared to 52% of those who see themselves at lower risk. Level of education plays a role in risk perception: three in five (60%) respondents with a postgraduate degree think their chances of falling ill are high, compared to just two in five (41%) of those with a high school degree or less. Education level also influences vaccine acceptance. Nearly three in four (73%) respondents with a postgraduate degree would take a vaccine when it becomes available compared to those with a college degree (71%), some college (57%) and just half (48%) of those with a high school degree or less.
Another worrisome indicator is that less than half (45%) of New Yorkers reported being vaccinated for the flu this past season and 20% of respondents said they have never been vaccinated for flu at all.
“Given the substantial pockets of resistance to vaccination that had arisen in New York and elsewhere prior to the coronavirus pandemic, we have every reason to be concerned about numbers like these,” stated Dr. Scott Ratzan, Distinguished Lecturer at CUNY SPH and director of the coronavirus tracking survey project. “As researchers move forward with studies in more than 150 potential coronavirus vaccines, we would do well to develop a parallel range of communication efforts to promote them amongst populations with varying levels of education.”
Survey methodology:
The CUNY Graduate School of Public Health and Health Policy (CUNY SPH) survey was conducted by Emerson College Polling from April 24-26, 2020 (week 7). This tracking effort started March 13-15 (week 1), and continued with questions fielded March 20-22 (week 2) and March 27-29 (week 3), April 3-5, 2020 (week 4), April 10-12, 2020 (week 5), April 17-29 (week 6).
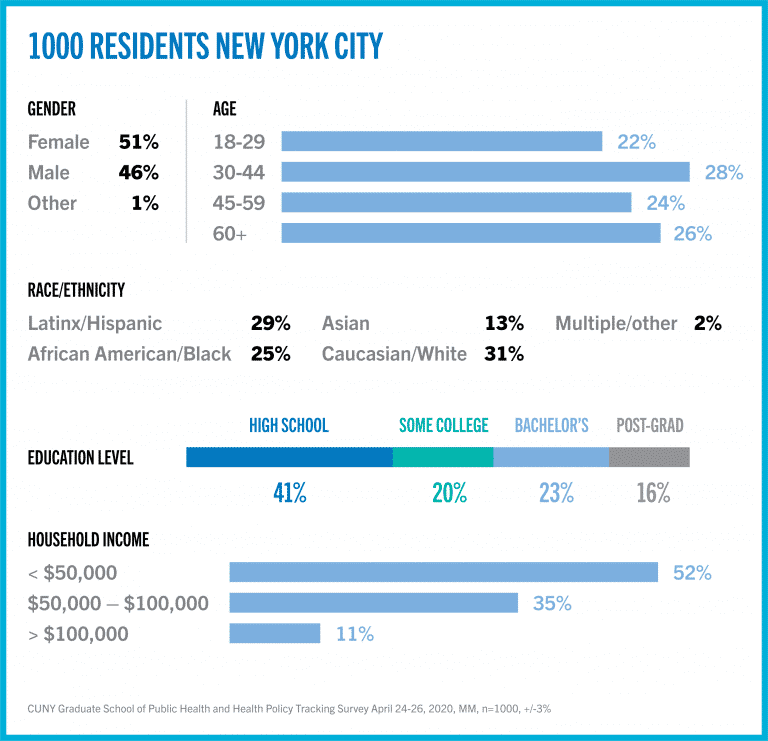
The sample for the NY Statewide and New York City results were both, n=1,000, with a Credibility Interval (CI) similar to a poll’s margin of error (MOE) of +/- 3 percentage points. The data sets were weighted by gender, age, ethnicity, education, and region based on the 2018 1-year American Community Survey model. It is important to remember that subsets based on gender, age, ethnicity, and region carry with them higher margins of error, as the sample size is reduced. In the New York City results, data was collected using an Interactive Voice Response (IVR) system of landlines (n=478), SMS-to-online (n=268) and an online panel provided by MTurk and Survey Monkey (n=254). In the Statewide results, data was collected using an Interactive Voice Response (IVR) system of landlines (n=511), SMS-to-online (n=240) and an online panel provided by MTurk and Survey Monkey (n=249).
In the statewide survey regions were broken out into the following:
- Region 1: Long Island 14.7% (USC1-4), Shirley, Seaford, Glen Cove, Garden City
- Region 2: NYC 45.3% (USC 5-16) Queens, Brooklyn, Manhattan, Staten Island, Bronx
- Region 3: Upstate 40% (USC 17-27): Albany, Harrison, Carmel, Rhinebeck, Amsterdam, Schuylerville, Utica, Corning, Irondequoit, Buffalo, Rochester
*Household cohort was calculated by asking respondents to give the number of members living within the household. This number was used to calculate that from the n=1,000 respondents, the total people living in these households was n=2,772.