

Haley Primary Voters Break for Biden over Trump in General Election
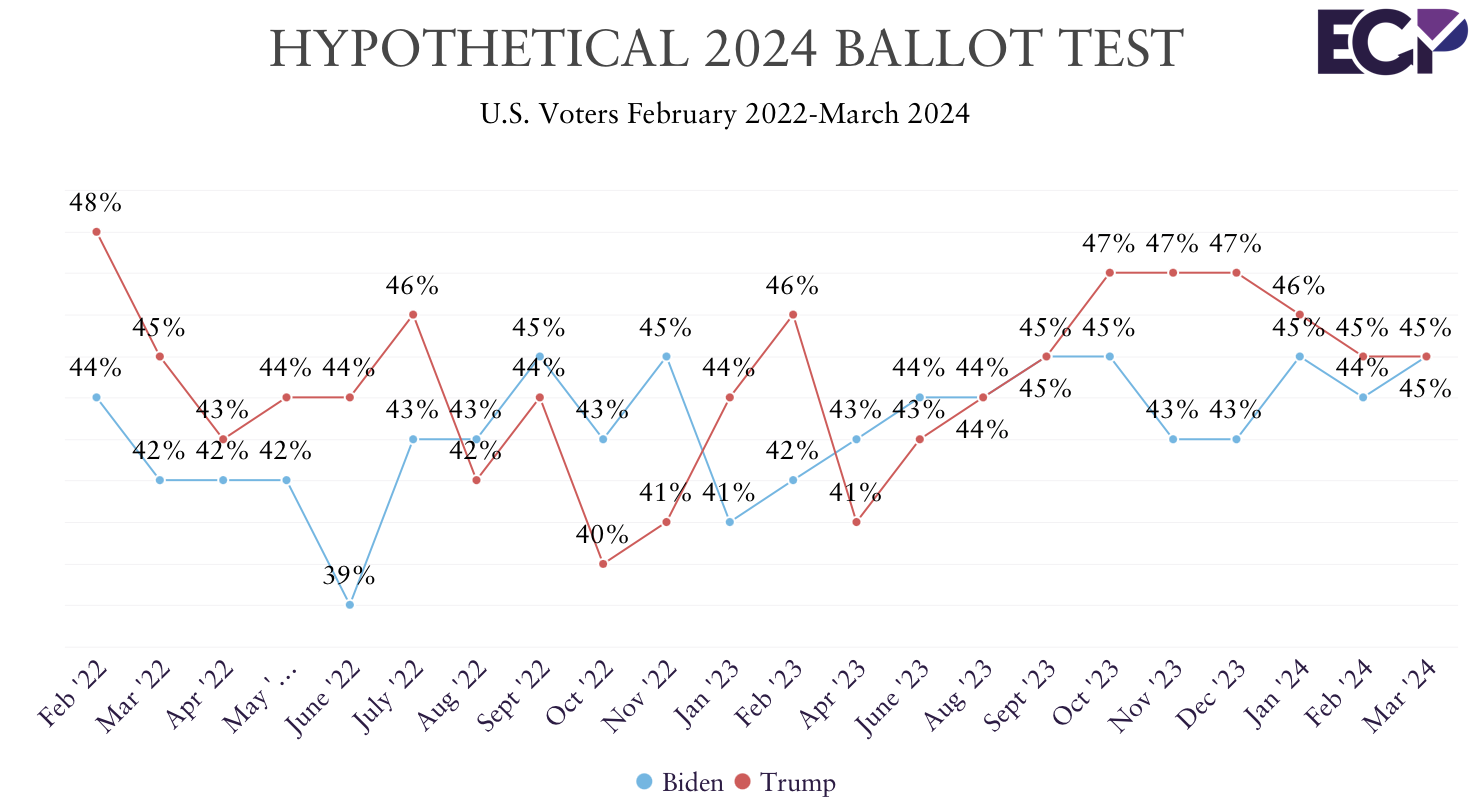
A new Emerson College Polling national survey of voters finds President Joe Biden and former President Donald Trump tied at 45% in a November general election matchup, while 10% are undecided. When undecided voters are asked which candidate they lean toward, Biden’s overall support increases to 51% and Trump to 49%.
“Biden leads Trump among voters under 30, 43% to 37%, with 20% undecided. When these voters are forced to choose between Biden and Trump and their support is included in the total, 58% support Biden and 42% Trump,” Spencer Kimball, executive director of Emerson College Polling, said.
- Haley primary voters break for Biden in the general election, 63% to 27%, with 10% undecided. In 2020 these voters broke for Biden 52% to 36%.
- Independent voters break for Trump 42% to 39%, with 19% undecided. With the undecided push, Biden’s support increases to 52% and Trump to 48%.
- Those who did not vote in 2020 break for Trump 46% to 17%, with 36% undecided.
Voters were asked why they support Biden or Trump.
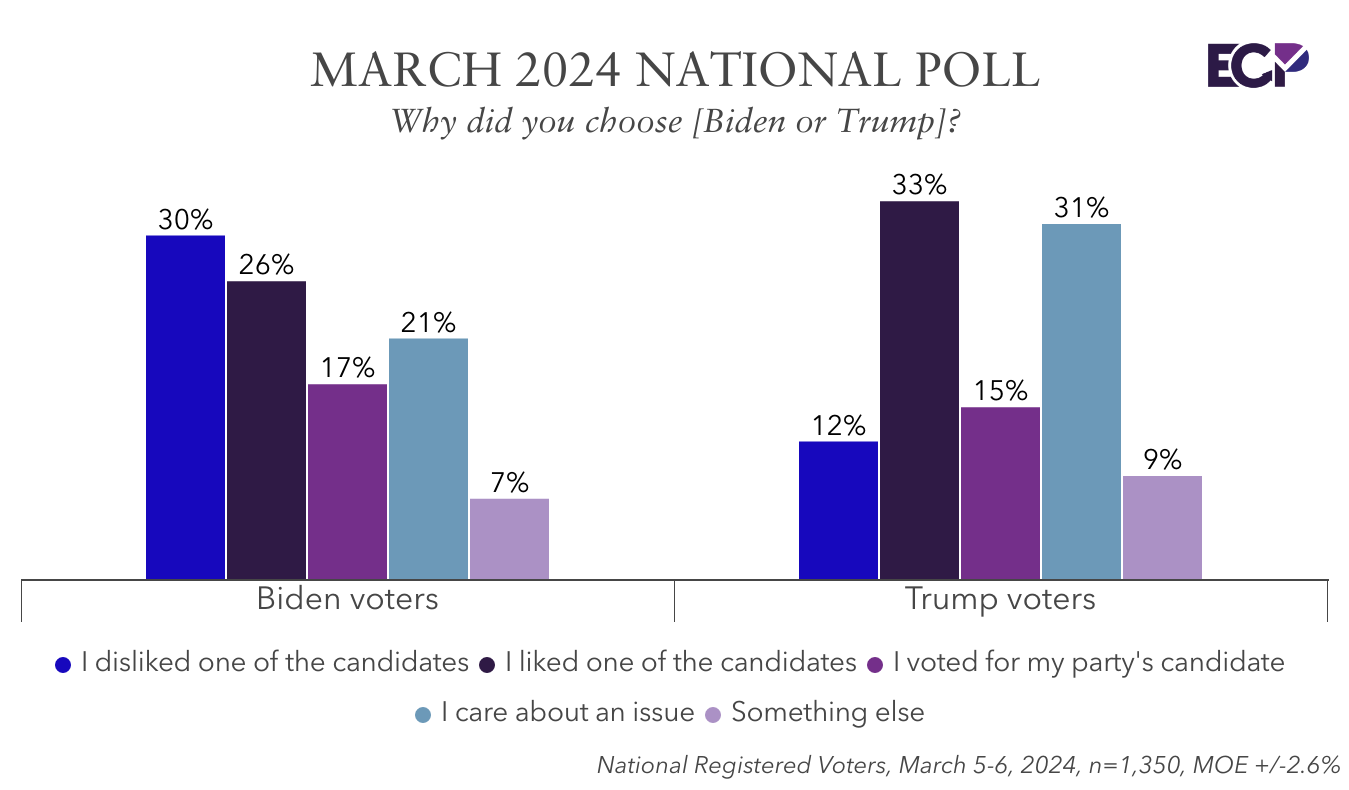
- Among Biden voters, 30% support him because they dislike Trump, 26% because they like Biden, 21% because they care about an issue, and 17% support their party’s candidate.
- Among Trump voters, 33% support him because they like Trump, 31% care about an issue, 15% support their party’s candidate, and 12% because they dislike Biden.
With third-party candidates on the ballot, 43% support Trump, 42% Biden, 6% Robert Kennedy Jr., 2% Cornel West, and 1% Jill Stein. Seven percent are undecided.
- Among Trump voters, 83% say they will definitely support him, while 17% could change their minds. Among Biden voters, 87% will definitely support him, and 13% could change their minds. Of Kennedy voters, 57% could change their minds, while 43% will definitely support him.
“This race is well within the poll’s margin of error and could move in either direction. When undecided voters are pushed in the head-to-head matchup, Biden gains a two-point lead; however, when third-party candidates are factored in, Trump has nearly a two-point edge.”
Voters were asked if they think Biden or Trump would do a better job on immigration and border security, abortion access, and the Israel-Hamas war.
- Immigration and border security: 52% Trump, 48% Biden
- Israel-Hamas war: 51% Trump, 49% Biden
- Abortion access: 58% Biden, 42% Trump.
“Independents think Trump would do a better job handling the border than Biden, 53% to 47%, but think Biden would do a better job on abortion access, 61% to 39%, and the Israel-Hamas war, 52% to 48%,” Kimball noted.
The economy is the top issue for 29% of voters, followed by immigration (20%), threats to democracy (14%), healthcare (12%), crime (7%), housing affordability (6%), abortion access (5%), and education (5%).
- Immigration is the top concern among voters over 70, at 34% compared to 9% of voters under 30.
President Biden holds a 41% job approval rating and 48% disapproval. Voters were also asked if they have a favorable or unfavorable view of Biden and Trump. Fifty percent have a favorable view of Biden (28% very favorable, 22% somewhat favorable), while 48% have a favorable view of Trump (32% very favorable, 16% somewhat favorable). Fifty percent have an unfavorable view of Biden (13% somewhat unfavorable, 37% very unfavorable), and 52% have an unfavorable view of Trump (12% somewhat unfavorable, 40% very unfavorable).
On the generic congressional 2024 ballot, 45% support the Democratic candidate, 43% the Republican, and 12% are undecided.
Methodology
The Emerson College Polling national survey was conducted March 5-6, 2024. The sample of registered voters, n=1,350, has a credibility interval, similar to a poll’s margin of error (MOE), of +/- 2.6 percentage points. The data sets were weighted by gender, education, race, age, party affiliation, and region based on 2024 registration modeling. Turnout modeling is based on U.S. Census parameters, and voter registration data.
It is important to remember that subsets based on demographics, such as gender, age, education, and race/ethnicity, carry with them higher credibility intervals, as the sample size is reduced. Survey results should be understood within the poll’s range of scores, and with a confidence interval of 95% a poll will fall outside the range of scores 1 in 20 times.
Data was collected by contacting an Interactive Voice Response (IVR) system of landlines and a consumer list of emails (both provided by Aristotle), and an online panel of voters provided by Alchemer.
All questions asked in this survey with exact wording, along with full results, demographics, and cross tabulations can be found under Full Results. This survey was funded by Emerson College.


