Mamdani’s support increased from 1% to 23% from February to May
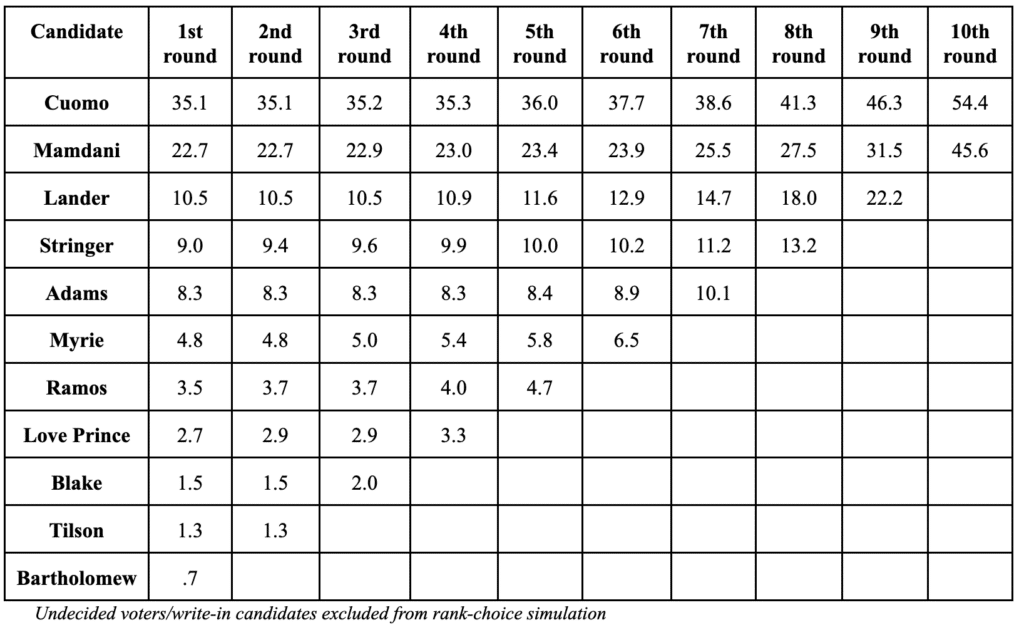
A new Emerson College Polling/PIX11/The Hill survey of New York City’s Democratic Primary for Mayor finds 35% of voters support former Governor Andrew Cuomo on the first round of the ballot, 23% support State Rep. Zohran Mamdani, 11% support Comptroller Brad Lander, 9% former State Rep. Scott Stringer, 8% City Council Speaker Adrienne Adams, and 5% State Senator Zellnor Myrie. After ten rounds of rank choice simulation, Cuomo passes the 50% threshold with 54%, and Mamdani ends with 46%.

“Cuomo has led in the polls since early 2025, but Mamdani has surged, gaining 23 points and winning second-choice votes nearly 2-to-1, cutting Cuomo’s ranked-choice lead from 12 points to 9 points,” Spencer Kimball, executive director of Emerson College Polling, said. “With four weeks to go, the question is whether Cuomo can run out the clock, or if he needs to win over second-choice voters to hold off Mamdani’s momentum.”
“Cuomo’s strongest support comes from Black voters (74%), voters over 50 (66%), and women (58% to 42%),” Kimball added. “Mamdani leads among voters under 50 with 61%, and holds an edge among white voters (57% to 43%) and college-educated voters (58% to 42%).”
Mark Levine leads the first round of voting for the Democratic Primary for Comptroller with 51% support, followed by Justin Brannan with 23%, Kevin Parker with 16%, and Ismael Malave with 10%.
In the Democratic Primary for New York City Public Advocate, incumbent Jumaane Williams leads with 56% selecting him as their first choice, followed by Jenifer Rajkumar with 15% and Marty Dolan with 13%. Sixteen percent are undecided on their first choice.
Looking ahead to the November general election, Cuomo leads a hypothetical matchup with a plurality of support (44%), while 13% support Republican candidate Curtis Sliwa, 10% support current Mayor Eric Adams as an independent candidate, and 7% support independent candidate Jim Walden. Twenty-six percent are undecided.
With Mamdani as the Democratic nominee, 35% would support him in a hypothetical general election, 16% Sliwa, 15% Adams, and 6% Walden.
President Trump holds a 27% favorable rating among New York City voters, while 69% have an unfavorable view of the president. Mayor Eric Adams has a 19% favorable rating, and 69% unfavorable rating.
Former Governor Cuomo holds a 41% favorable rating among New York City voters, and a 47% unfavorable rating; 11% are neutral.
Half of New York City voters think mass deportations of undocumented immigrants in New York City are negatively impacting the city, while 30% think they are positively impacting the city; 20% are unsure. Voters were asked in February if they thought it would have a positive or negative impact: 42% thought it would be negative and 41% thought it would be positive.
Nearly half of New York City voters (49%) say that they and their family’s finances are worse off now than a year ago, 35% say they are about the same, and 16% say they are better off than a year ago.
A majority of New York City voters (61%) support making it easier for first responders to forcibly hospitalize mentally ill people who are determined unable to meet their basic needs, while 13% oppose making it easier and 26% are unsure.
Forty-six percent do not think it is important that the next Mayor of New York City has a pro-Israel stance, compared to 33% who believe it is somewhat or very important that they do. Twenty-one percent have no opinion.
Methodology
The Emerson College Polling/PIX11/The Hill New York City survey was conducted May 23-26, 2025. The sample of New York registered voters, n=1,000, has a credibility interval, similar to a poll’s margin of error (MOE), of +/- 3 percentage points. The sample of Democratic Primary voters includes n=606, with a credibility interval of +/-3.9%. The final mayoral rank-choice simulation includes n=500 with a margin of error of +/-4.3%. The data sets were weighted by gender, education, race, age, party registration, and region based on 2025 voter turnout modeling.
It is important to remember that subsets based on demographics, such as gender, age, education, and race/ethnicity, carry with them higher credibility intervals, as the sample size is reduced. Survey results should be understood within the poll’s range of scores, and with a confidence interval of 95% a poll will fall outside the range of scores 1 in 20 times.
Data was collected by contacting cell phones via MMS-to-web text (voter list provided by Aristotle), along with an online panel of voters provided by CINT. Panel responses were matched to the Aristotle voter file using respondents’ full name and ZIP code; responses that were not matched to a unique NYC voter were removed from the final data set. The survey was offered in English.
All questions asked in this survey with the exact wording and ordering, along with full results, demographics, and cross tabulations can be found under Full Results. This survey was funded by Nexstar Media.


