Voters Disapprove of Trump’s Handling of Economy and Foreign Policy, Remain Divided on Immigration
A new Emerson College Polling national survey that marks 100 days of the Trump administration finds President Trump with a 45% job approval, and 45% disapproval; 10% are neutral. Since the 50-Day Emerson poll, the president’s approval has decreased by two points, while his disapproval has not changed.
Voters who participated in the 2024 election were asked how they would vote if they could go back in time to the 2024 election, knowing what they know now: 93% of Harris voters and 94% of Trump voters would still vote for the candidate they voted for in 2024, giving Trump a 48% to 47% advantage.
“Despite several unpopular domestic and foreign policies, President Trump still holds an entrenched base of voters who, if given the chance, say they would vote for him again,” Spencer Kimball, executive director of Emerson College Polling, said. “Areas of concern for the president include economic and foreign policy, with voters disapproving of his actions on tariffs and in the Russia-Ukraine war, while voters continue to be divided on immigration and deportation policy.”
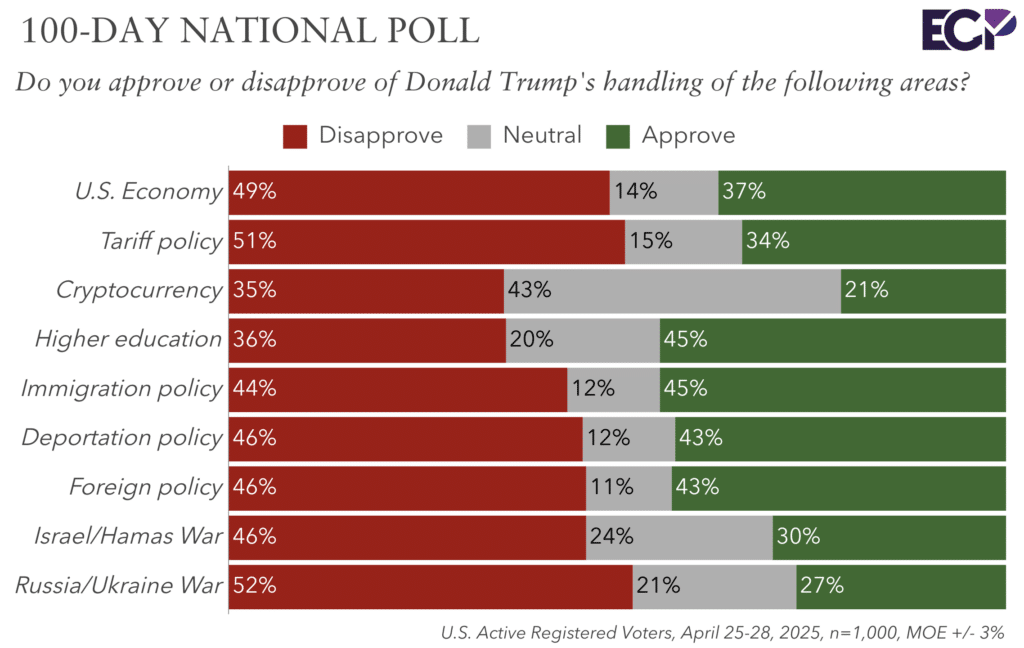
A plurality of voters (49%) think Trump’s economic policy is making the economy worse, while 29% think the administration’s policies are making it better; 23% think it has no effect or it is too soon to tell. Overall, 37% approve of Trump’s handling of the U.S. economy, while 49% disapprove.

Approval regarding President Trump’s handling of the Russia-Ukraine War decreased significantly since the 50-day poll. Now, 27% approve of Trump’s handling of the Russia-Ukraine war, a 14-point drop since March, and 52% disapprove, a seven-point increase in disapproval. Thirty percent approve of Trump’s handling of the war between Israel and Hamas, an eight-point drop since March, while 46% disapprove, a five-point increase.
On tariff policy, 34% approve and 51% disapprove. On cryptocurrency, 21% approve of the president’s handling and 35% disapprove.
Approval of the President’s handling of immigration policy decreased from 48% to 45% this month, while disapproval increased from 40% to 44%. Deportation policy approval is slightly lower: 43% approve and 46% disapprove.
Regarding the President’s handling of higher education, 45% approve and 36% disapprove, with 20% neutral.
Fifty-two percent think Trump’s second term in office is more of a failure, while 48% consider it more of a success.
“Trump’s base of Republican voters consider his second term to be more of a success, 86% to 14%, whereas Democrats consider it a failure, 88% to 12%,” Kimball added. “Independents are more divided, with 55% to 45% considering it more of a failure.”
The share of voters who think Trump is doing worse than expected in his second term increased by seven points since the 50-day poll, to 43%. Thirty-four percent think he is doing better than expected, a decrease of five points, and 23% think his performance is about as expected.
A plurality of voters (47%) disapprove of the job Elon Musk is doing at the Department of Government Efficiency, while 41% approve and 13% are neutral.
Vice President JD Vance holds a 39% favorable rating and a 43% unfavorable rating. A third (33%) have a favorable view of Secretary of Defense Pete Hegseth, while 39% have an unfavorable view of him. Robert F. Kennedy Jr. has a 41% favorable rating and a 40% unfavorable rating.
Thirty-seven percent have a favorable view of the Supreme Court, while a third (33%) have an unfavorable view of it.
Methodology
The Emerson College Polling national survey was conducted April 25-28, 2025. The sample of US active registered voters*, n=1,000, has a credibility interval, similar to a poll’s margin of error (MOE), of +/- 3 percentage points. The data sets were weighted by gender, education, race, age, party registration, and region based on U.S. Census parameters and voter file data.
It is important to remember that subsets based on demographics, such as gender, age, education, and race/ethnicity, carry with them higher credibility intervals, as the sample size is reduced. Survey results should be understood within the poll’s range of scores, and with a confidence interval of 95% a poll will fall outside the range of scores 1 in 20 times.
Data was collected by contacting a voter list of cellphones via MMS-to-web text, of opt-in emails and an online panel of voters provided by Commonwealth Opinions. Commonwealth Opinions’ panel includes voters previously opted-in to taking additional surveys through MMS-to-web and email surveys. Panel responses were matched to the Aristotle voter file using respondents’ full name and ZIP code. The survey was offered in English.
All questions asked in this survey with the exact wording, along with full results, demographics, and cross tabulations can be found under Full Results. This survey was funded by Emerson College.
*A sample of active registered voters includes registered voters that have been verified to have participated in at least one election within the past five years (including the 2020 general or primary election, 2022 general or primary election, and/or the 2024 general election). This also includes voters who are now eligible to vote but previously were not eligible, like those who have recently turned 18.


