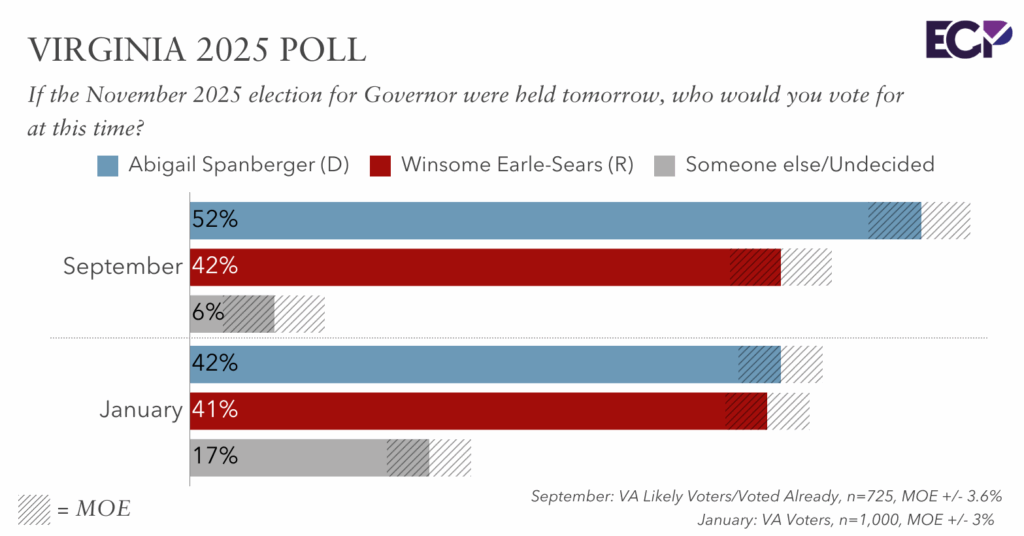
A new Emerson College Polling/The Hill survey of the 2025 Virginia Governor’s race finds Democrat Abigail Spanberger leading Republican Winsome Earle-Sears, 52% to 42%, with 5% of voters undecided. Those who have already voted early in Virginia report voting for Spanberger, 60% to 38%, while likely voters who have yet to cast a ballot support Spanberger 50% to 43%.

Since the first Emerson College poll of the race in January 2025, Spanberger’s support increased ten points from 42% to 52%, while Earle-Sears picked up one percentage point, from 41% to 42%.
“Spanberger has picked up significant momentum since the first Emerson College poll at the beginning of 2025, driven by increases in support from independents, males and younger voters,” Spencer Kimball, executive director of Emerson College Polling, said. “Independent voters support Spanberger by a 19-point margin; a reversal from January, when they supported Earle-Sears by four points. Notably, the male vote, which traditionally favors the Republican candidate, shifted from a 15-point advantage for Earle-Sears to an even split, with 46% supporting each candidate.”
“Spanberger’s support also increased among voters under 50: what was once a narrow 41% to 39% edge has grown into a 27-point lead, 59% to 32%,” Kimball continued, “Meanwhile, Earle-Sears has not consolidated support among older voters; in January, those 50 and older were evenly divided, 43% for Spanberger and 42% for Earle-Sears. Nine months later, the group remains split with 49% for Earle-Sears and 47% for Spanberger.”
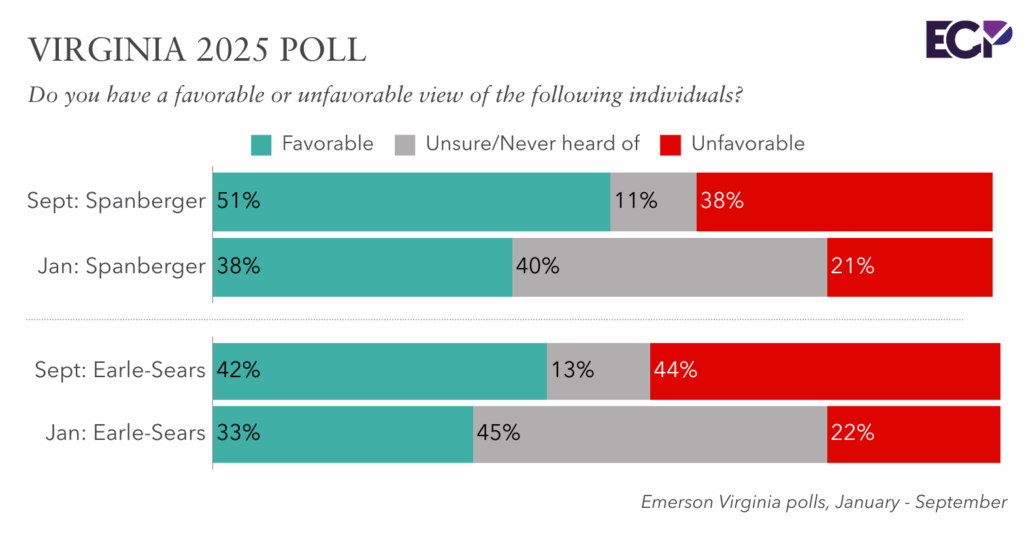
Spanberger and Earle-Sears’ share of support generally reflects their favorability in the state: 51% have a favorable view of Spanberger, while 42% have a favorable view of Earle-Sears. Thirty-eight percent have an unfavorable view of Spanberger, while 44% have an unfavorable view of Earle-Sears.

Governor Glenn Youngkin holds a 46% job approval rating, while 41% disapprove of the job he is doing as governor. President Donald Trump holds a 42% job approval rating, while 54% disapprove of the job he is doing in the Oval Office.
“While Governor Youngkin maintains a positive approval rating, Lieutenant Governor Earle-Sears does not appear to benefit from it,” Kimball noted. “ Among voters who approve of the Governor, 11% plan to support Spanberger, while 4% of those who disapprove of the Governor plan to support Earle-Sears.”
The top issue for Virginia voters is the economy at 35%, followed by threats to democracy at 20%, education at 10%, healthcare at 9%, housing affordability at 8%, immigration at 6%, and crime at 6%.
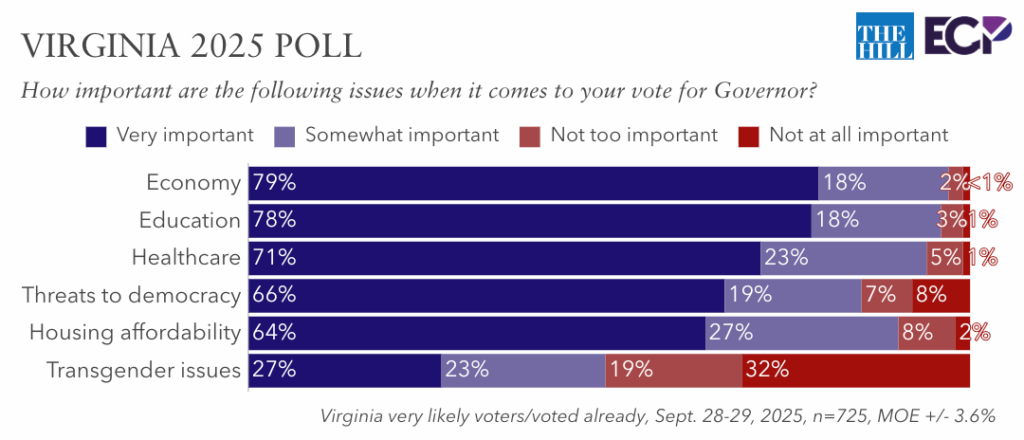
When it comes to how important issues are when it comes to their vote for governor: 79% say the economy is “very important” when it comes to their vote, 78% say the same of education, 71% healthcare, 66% threats to democracy, 64% housing affordability, and 27% find transgender issues “very important” to their vote.

Those who rate the economy as “very important” to their vote break for Spanberger, 51% to 44%.
A majority of voters (76%) think the personal property tax, or car tax, should be eliminated in Virginia, while 15% think it should not; 9% are unsure. Eliminating this tax is popular across partisan lines: 89% of Republicans, 66% of Democrats and 73% of independent voters support eliminating the car tax.
Forty-two percent support more data centers, or large facilities storing and processing digital information, being built in Virginia, while 39% oppose more centers being built; 18% are unsure.
Sixty-five percent are very or somewhat familiar with data centers in Virginia, while 35% are not too/not at all familiar with them.
Methodology
The Emerson College Polling/The Hill Virginia survey was conducted September 28-29, 2025. The overall sample of Virginia likely voters, n=725, has a credibility interval, similar to a poll’s margin of error (MOE), of +/- 3.6 percentage points. The data sets were weighted by gender, education, race, age, party registration, previous vote history, and region based on U.S. Census parameters and voter file data.
It is important to remember that subsets based on demographics, such as gender, age, education, and race/ethnicity, carry with them higher credibility intervals, as the sample size is reduced. Survey results should be understood within the poll’s range of scores, and with a confidence interval of 95% a poll will fall outside the range of scores 1 in 20 times.
Data was collected by contacting a voter list of cellphones via MMS-to-web text (list provided by Aristotle), and an online panel of voters provided by CINT. Panel responses were matched to the Aristotle voter file using respondents’ full name and ZIP code. The survey was offered in English.
All questions asked in this survey with the exact wording, along with full results, demographics, and cross tabulations can be found under Full Results. This survey was funded by Nexstar Media.


