

Biden and Trump Supporters Rally Behind Same NCAA Tournament Teams: Iowa in Women’s and NC State in Men’s
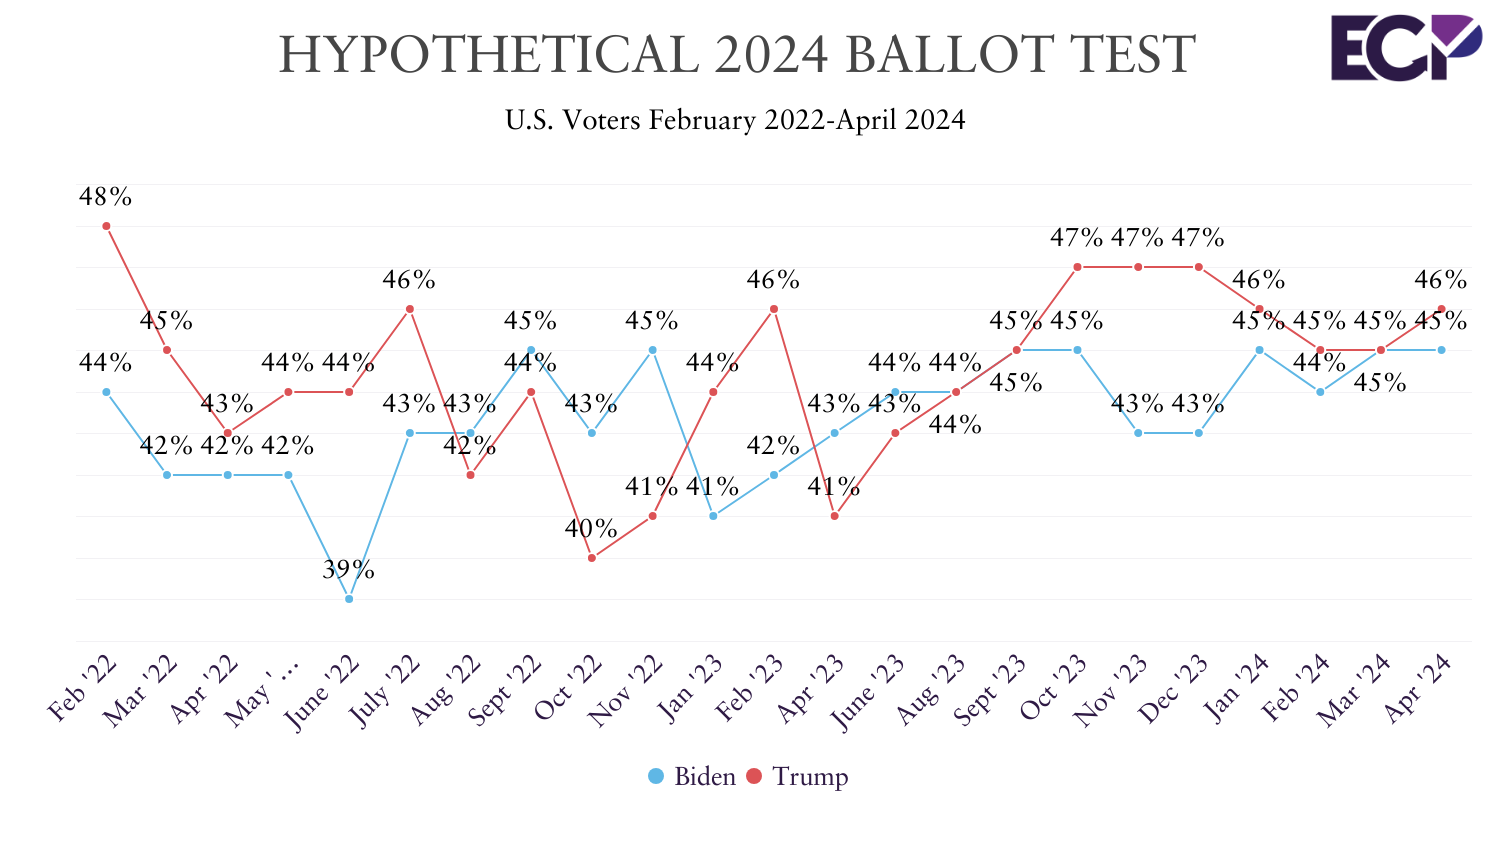
The April Emerson College Polling national poll finds 46% of voters support former President Donald Trump, 45% support President Joe Biden, and 8% are undecided in the November presidential election. When undecided voters are asked which candidate they lean toward, Trump’s overall support increases to 51%, and Biden to 49%.
With third-party candidates on the ballot, 43% support Trump, 42% Biden, 8% Robert Kennedy Jr., and 1% support Cornel West and Jill Stein; 6% are undecided.
“In a surprising twist, while Trump maintains a slight lead over Biden among registered voters at 51% to 49%, the tables turn among very likely voters, with Biden edging ahead at 51% to 49%. This defies conventional wisdom, challenging the notion that Trump supporters are more energized. This marks the initial inclusion of a general election voting intention question in the Emerson Poll this election cycle,” Spencer Kimball, executive director of Emerson College Polling, said.
“Among independent voters, 44% support Trump, 41% Biden, and 14% are undecided. With third-party candidates on the ballot, 40% support Trump, 37% Biden, and 10% support Robert F. Kennedy Jr.”
Regardless of which candidate they support, 48% expect Trump to be president after the election, 45% Biden.
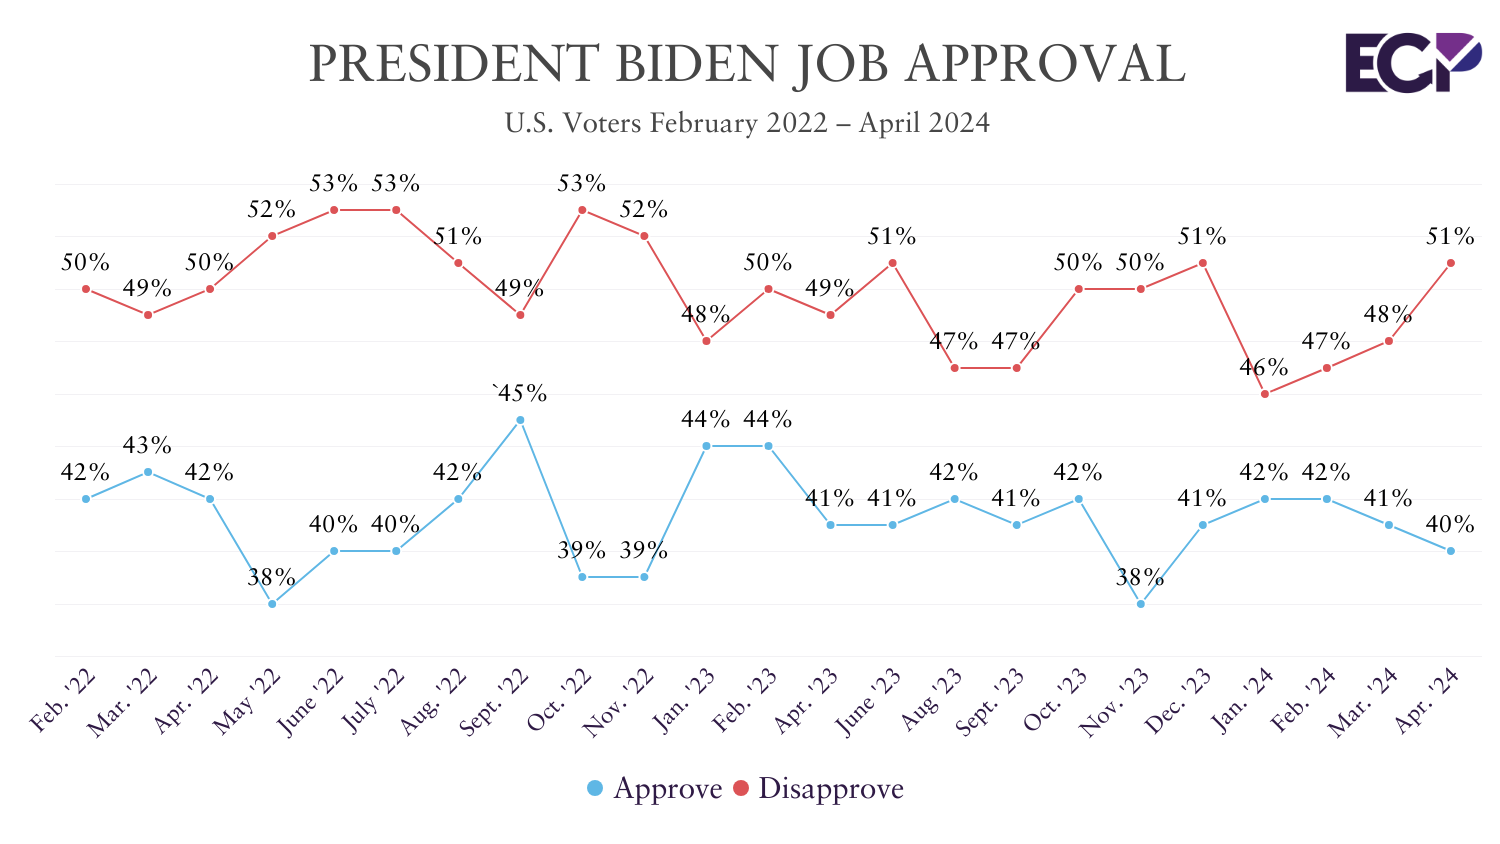
President Biden has a job approval rating of 40% and a 51% disapproval rating. Nine percent are neutral.
Voters were asked if they have a favorable or unfavorable view of a series of public figures.
- Joe Biden: 46% favorable, 54% unfavorable
- Donald Trump: 48% favorable, 52% unfavorable
- Kamala Harris: 43% favorable, 53% unfavorable, 4% not familiar
- Robert F. Kennedy Jr.: 42% favorable, 43% unfavorable; 15% not familiar
- Nicole Shanahan: 12% favorable, 27% unfavorable; 62% not familiar
- Pete Buttigieg: 33% favorable, 38% unfavorable; 29% not familiar
On the generic congressional ballot, 46% of voters support the Democratic candidate, 45% the Republican candidate; 9% are undecided.
The top issue for 35% of voters is the economy, followed by immigration (22%), threats to democracy (13%), healthcare (7%), crime (6%), abortion access (6%), housing affordability (5%), and education (3%).
As baseball season kicks off, voters were asked to choose one sport as “America’s sport” even if they don’t personally follow it. Football is viewed as America’s sport by 49% of voters, followed by baseball (26%), basketball (12%), hockey (4%), auto racing (3%), and soccer (3%).

- Trump and Biden voters agree that football is America’s sport (50% of Biden voters and 48% of Trump voters).
A majority (55%) of voters have watched at least a little of this year’s Men’s or Women’s NCAA March Madness basketball tournament, while 45% have not tuned in.
In the Women’s Final Four, a plurality of voters (35%) are rooting for Iowa, 16% for South Carolina, 13% for NC State, and 10% for UConn; 26% have no preference.
- In the Northeast, 35% are rooting for Iowa, and 26% for UConn.
- In the South, 28% are rooting for South Carolina, 26% Iowa, and 17% NC State.
- In the Midwest, 56% are rooting for Iowa.
- In the West, 27% rooting for Iowa, 42% do not have a preference.
In the Men’s Final Four, 25% are rooting for NC State, 15% for Alabama, 16% for UConn, and 14% for Purdue; 30% have no preference.
- In the Northeast, 39% are rooting for UConn, 21% NC State.
- In the South, 33% are rooting for NC State, 21% Alabama.
- In the Midwest, 27% are rooting for Purdue, 17% NC State.
- In the West, 23% are rooting for NC State, 16% Purdue, and 15% Alabama.
Biden and Trump voters are both rooting for Iowa in the women’s tournament (37% of Trump voters and 33% of Biden voters), and NC state in the men’s tournament (26% of Trump voters and 25% of Biden voters).
Voters were asked how much of a threat to public health in the United States they view measles as. Seventeen percent view them as a major threat, 33% a moderate threat, 36% a minor threat, and 15% do not view it as a threat at all.
Methodology
The Emerson College Polling national survey was conducted April 2-3, 2024. The sample of registered voters, n=1,438, has a credibility interval, similar to a poll’s margin of error (MOE), of +/- 2.5 percentage points. The data sets were weighted by gender, education, race, age, party affiliation, and region based on 2024 registration modeling. Turnout modeling is based on U.S. Census parameters, and voter registration data.
It is important to remember that subsets based on demographics, such as gender, age, education, and race/ethnicity, carry with them higher credibility intervals, as the sample size is reduced. Survey results should be understood within the poll’s range of scores, and with a confidence interval of 95% a poll will fall outside the range of scores 1 in 20 times.
Data was collected by contacting an Interactive Voice Response (IVR) system of landlines and a consumer list of emails (both provided by Aristotle), and an online panel of voters provided by Alchemer.
All questions asked in this survey with exact wording, along with full results, demographics, and cross tabulations can be found under Full Results. This survey was funded by Emerson College.


