

Social Media is the Primary News Source for Voters Under 30; 76% of Young Voters Say Their Parents’ Generation Had Better Economic Opportunity Than Their Own
A new Emerson College Polling survey of U.S. voters finds President Biden continuing to trail former President Donald Trump, 43% to 47%, with 9% of voters undecided. With independent or third-party candidates Robert Kennedy Jr., Cornel West, and Jill Stein added to the ballot, Trump’s support drops to 43%, Biden’s to 37%, while 7% support Kennedy, with 1% for Stein and West respectively. Twelve percent are undecided. In a matchup between Joe Biden and Nikki Haley, 39% support both candidates respectively, while 23% are undecided. These numbers reflect last month’s polling, and this month’s survey oversampled young voters to better understand their changes in attitude toward President Biden.
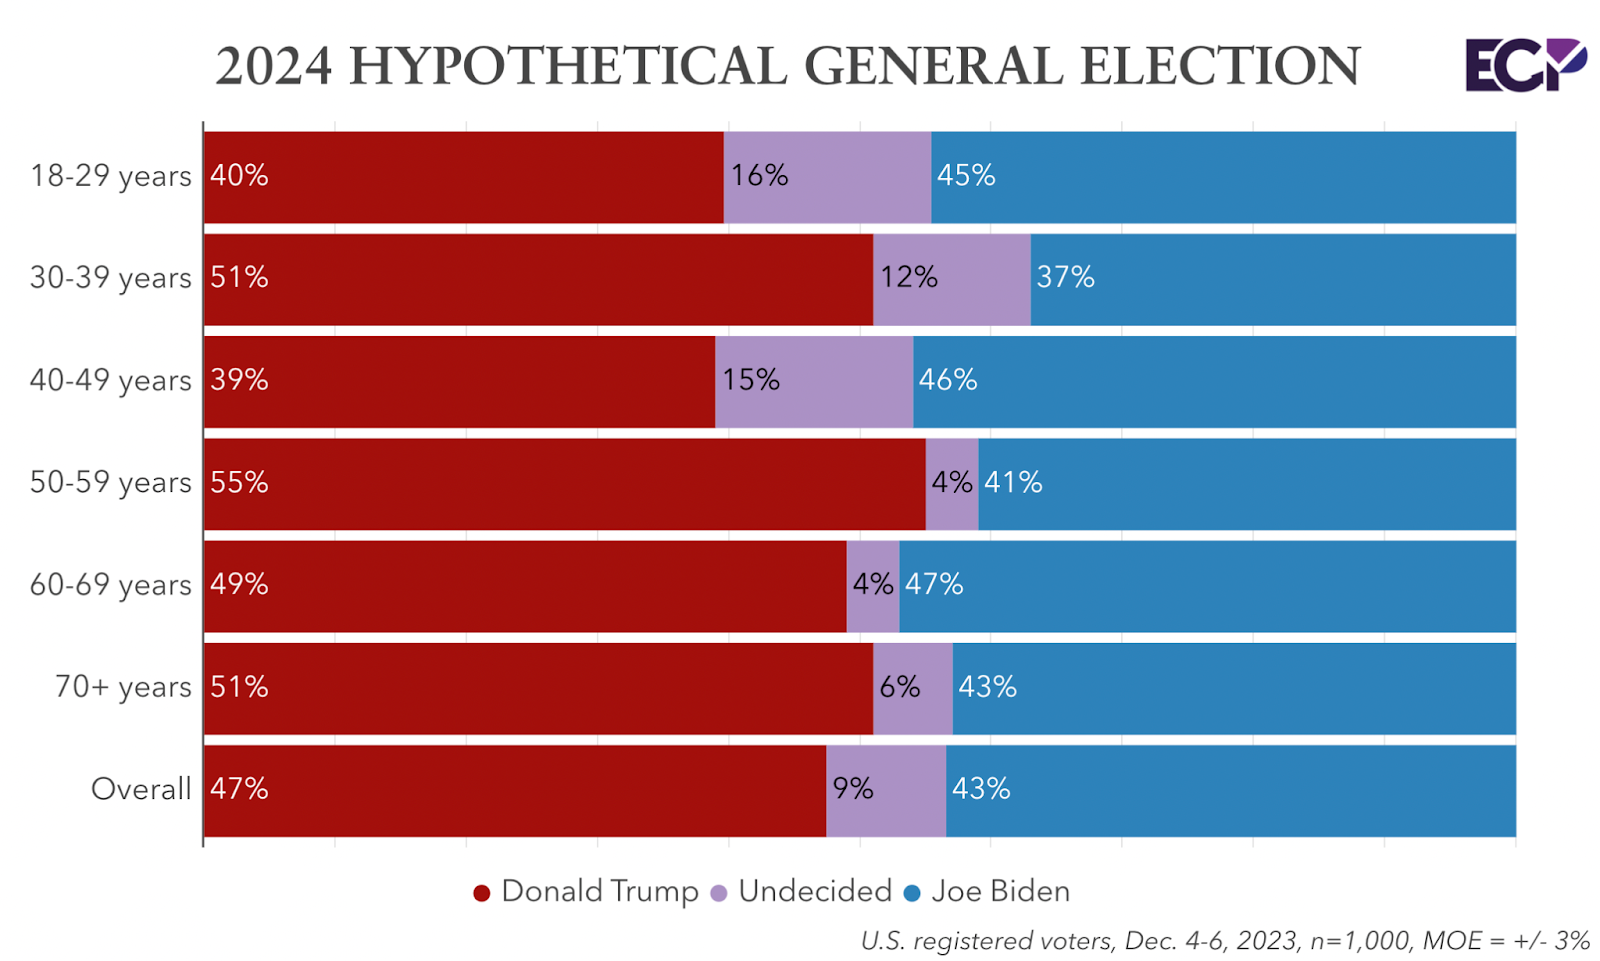
Spencer Kimball, Executive Director of Emerson College Polling, said, “In the oversample of voters under 30, 45% support Biden and 40% support Trump in a head-to-head matchup, while 16% are undecided. Within this group, there is a divide between voters under and over 25. Of voters under 25, 48% support Biden and 35% Trump, while voters between 25 and 29 are split: 44% support Trump and 42% support Biden.”
The oversample of voters under 30 included n=182 new voters who did not participate in 2020. Forty-three percent of these new voters support Trump in 2024 while 21% support Biden (+/- 7.2%).
Economic Concerns Highest Among Voters Under 30
The economy remains the top issue voters are concerned about at 38%, while 15% find ‘threats to democracy’ as the most important issue facing the U.S., 11% find immigration to be the top issue, 9% healthcare, 7% crime, 6% housing affordability, and 5% education.
- Concern for the economy is higher among voters under 30: 44% find the economy to be the most important issue facing the United States, followed by healthcare (14%), education (10%), crime (8%), and housing affordability (8%).
Voters under 30 were also asked what concerns them most in an open-ended response. The top words mentioned were ‘inflation’ (94 mentions), ‘economy’ (71 mentions), and ‘money’ (49 mentions); the words ‘worried’ or ‘concerned’ were mentioned 67 times. No other phrase was mentioned more than 29 times.
Over 3 in 4 (76%) voters under 30 believe their parents’ generation had better economic opportunities than their generation has today, while 24% disagree.
- This sentiment decreases with age: 71% of those in their 30s believe their parents’ generation had better opportunities, compared to 70% of voters in their 40s, 62% of those in their 50s, 58% of those in their 60s, and 50% of those 70 and older.
Kimball concluded: “The financial concerns and emotional strain among younger voters regarding the cost of living are influencing their perception of President Biden’s leadership. Some are losing confidence, not necessarily shifting to Trump, but exploring third-party options.”
Presidential Approval & 2024 Primaries
President Biden holds a 41% approval rating, while 51% disapprove of the job he is doing in the Oval Office.
- Biden’s approval is lower among voters between 18 and 24, at 35%, but increases to the overall average of 41% among voters between 25 and 29.
- “An area of concern for Biden with young voters is their perception of his handling of the situation in Israel: voters under 25 are most likely to rate Biden’s handling of the situation in Israel as ‘poor’ at 44%, and are least likely to rate his handling as excellent/good at 24%,” Spencer Kimball, Executive Director of Emerson College Polling, said. “This compares to 34% of those 25-29 who rate his handling as excellent or good, 35% of voters in their 30s, 31% of voters in their 40s, 36% of voters in their 50s, 39% of voters in their 60s, and 38% of voters 70 and over.”
In the 2024 Democratic Presidential Primary, Biden leads with 63%, while 5% support Marianne Williamson and 2% support Dean Phillips.
- Among Democrats under 30, Biden’s support is lower than the average at 56%, while 12% support Marianne Williamson, and 5% support Dean Phillips. Twenty-eight percent are undecided.
In the Republican Primary, Donald Trump maintains his lead with 64% support, followed by Nikki Haley with 14%, Ron DeSantis with 7%, Vivek Ramaswamy and Chris Christie with 4% respectively. In a hypothetical head-to-head matchup between just Trump and Haley, Trump leads 76% to 23%.
- Among Republicans under 30, Trump’s support is higher than the average at 73%, while 6% support Ramaswamy, 5% support DeSantis, and 3% Haley and Christie respectively.
Kimball noted, “As younger Democrats distance themselves from Biden, Trump’s formidable backing within the Republican primary is strongest among younger voters. This presents a potential quandary for Biden, who secured a nearly 2-to-1 victory among young voters in the 2020 election.”
2024 Congressional Elections
On a generic 2024 congressional ballot, 44% support the Democratic congressional candidate while 43% support the Republican congressional candidate.
- Among voters under 30, 48% support the Democratic candidate while 33% support the Republican candidate.
- “While President Biden earns 45% of the under-30 vote, a generic Democrat on the Congressional ballot performs three percentage points better with 48%,” Matt Taglia, Senior Director, noted. “Conversely, 33% of voters under 30 support a generic Republican for Congress, which is six points lower than Trump’s share of under-30 voters.”
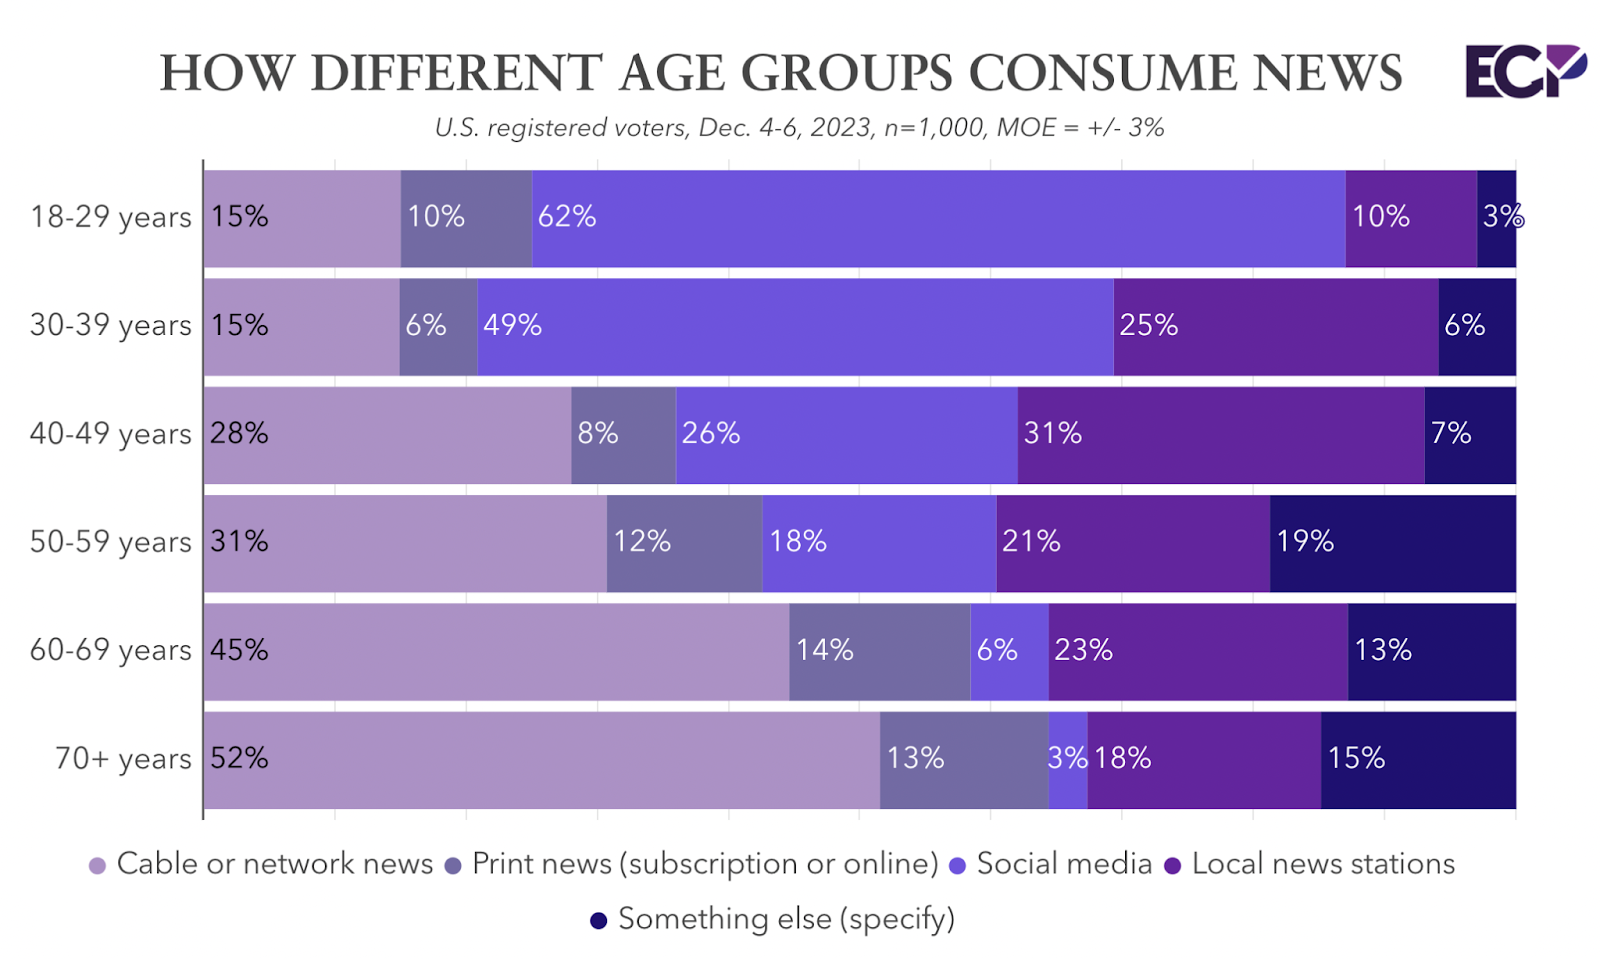
Media Usage Determined by Age
Which media source voters most rely on for news and information varies greatly by age. As voters age increases, so does their likelihood to rely on cable or network news for information: from 15% of those under 30 to 52% of those over 70. By contrast, the likelihood of relying on social media for news and information decreases with age: from 62% of those under 30 using it as their primary source, to 3% of those over 70. Local news stations as primary sources peak among those in their 40s at 31%.
X / Twitter
- Regarding usage of social media platforms, 65% of those under 30 use X (formerly known as Twitter) at least several days over two weeks, compared to 53% of those in their 30s, 44% of those in their 40s, 31% of those in their 50s, 20% of those in their 60s, and 8% of those over 70.
- Democrats are more likely to use Twitter at least several days over two weeks (43%) than Republicans (32%).
- Instagram is more used by voters: 82% of those under 30 use it at least several times every two weeks, compared to 75% of those in their 30s, 54% of those in their 4-0s, 30% of those in their 50s, 16% of those in their 60s, and 7% of those in their 70s.
- A majority of those under 60 use Facebook at least several times every two weeks: including 81% of those in their 30s, 78% of those in their 40s, 73% of those under 30, 67% of those in their 50s, 47% of those in their 60s, and 39% of those 70 and older.
TikTok
- Seventy-eight percent of voters under 30 use TikTok at least several times every two weeks, 43% of whom use it nearly every day. Sixty-five percent of voters in their 30s use TikTok several times in two weeks, 45% of those in their 40s, 20% in their 50s, 10% in their 60s, and just 2% of those over 70.
“This data illustrates the evolution of information consumption: Younger generations favor social media, while older individuals rely on cable and network news,” Kimball noted.
Anxiety Highest Among Young People; Decreases with Age
Voters were asked questions from the Generalized Anxiety Disorder 2-item as a tool to understand anxiety levels among voters. First, respondents were asked how often in the past two weeks they have been feeling nervous, anxious, or on edge. Fifty-eight percent feel this at least several days a week, including 32% who say several days in the past two weeks, 15% more than half the days, and 12% nearly every day. Forty-two percent responded “not at all.”
- Voters under 25 are most likely to experience feeling nervous, anxious, or on edge at least several days a week at 81%, lowering to 80% of those between 25-29, 79% of voters in their 30s, 73% of voters in their 40s, 33% of voters in their 50s, 42% of voters in their 60s, and 44% of voters 70 or older.
Next, respondents were asked over the last two weeks, how often they have not been able to stop or control worrying. A majority (52%) of voters overall have not experienced worrying at all, while 48% have experienced it at least several times in the past two weeks. A quarter have experienced worrying several times in the past two weeks, 11% have experienced it more than half the days of the past two weeks, and 12% experience worrying nearly every day.
- Similar to the first anxiety measurement tool, those under 30 are significantly more likely to note they experience not being able to stop or control worrying than those over 30: 72% of voters under 25 experience this at least several days in the past two weeks, 75% of those between 25-29 say the same, compared to 64% of voters in their 30s, 48% of voters in their 40s, 37% of voters in their 50s, 31% of voters in their 60s, and 34% of voters 70 or older.
METHODOLOGY
The Emerson College Polling national survey was conducted December 4-6, 2023. The sample of registered voters, n=1,000, has a credibility interval, similar to a poll’s margin of error (MOE), of +/- 3 percentage points. The data sets were weighted by gender, education, race, age, party affiliation, and region based on 2024 registration modeling. Turnout modeling is based on U.S. Census parameters, and voter registration data. An oversample of n=800 voters under 30 was collected to further analyze the youth vote.
It is important to remember that subsets based on demographics, such as gender, age, education, and race/ethnicity, carry with them higher credibility intervals, as the sample size is reduced. Survey results should be understood within the poll’s range of scores, and with a confidence interval of 95% a poll will fall outside the range of scores 1 in 20 times.
Data was collected by contacting an Interactive Voice Response (IVR) system of landlines and a consumer list of emails (both provided by Aristotle), and an online panel of voters provided by Alchemer.
All questions asked in this survey with exact wording, along with full results, demographics, and cross tabulations can be found under “Full Results.” This survey was funded by Emerson College.
###


