

Democrats Maintain Midterm Advantage
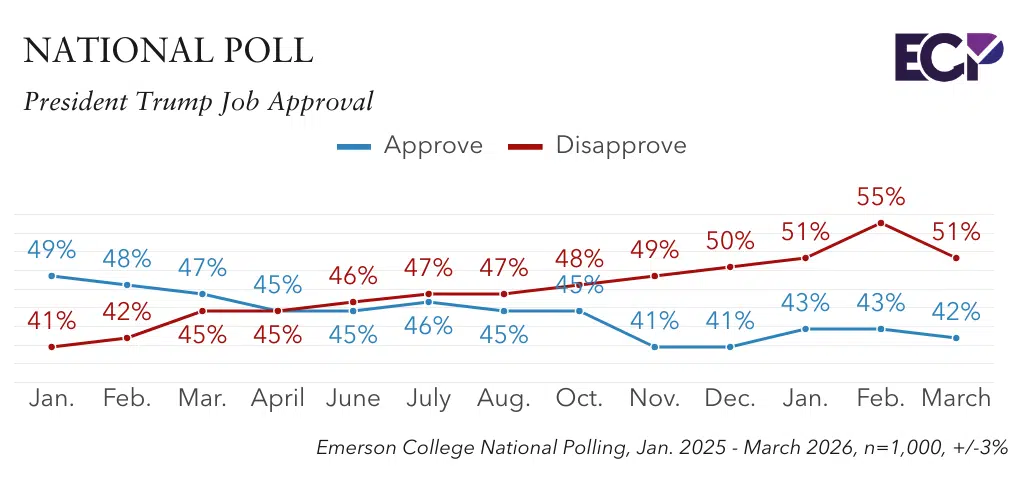
A new Emerson College Polling survey finds 42% of likely voters approve of the job President Trump is doing in the Oval Office, and 51% disapprove. The president’s approval dropped one point since last month, and disapproval dropped four points from its peak of 55% in February.
On the generic 2026 congressional ballot, 49% plan to support the Democratic candidate, while 42% support the Republican. Nine percent are undecided.
“Democrats have maintained an edge over congressional Republicans for the entirety of 2026, while Republican support has been consistent at 42%,” Spencer Kimball, executive director of Emerson College Polling, said. “Democrats have an 18-point advantage among independent voters, 49% to 31%, and a 21-point edge among Hispanic voters, leading 53% to 32%.”

Voters were asked if they have a favorable or unfavorable view of key Democratic figures and potential 2028 presidential candidates. Voters were asked the same of key Republican figures in January.

Among likely Democrat voters, 79% view Kamala Harris favorably, followed by Alexandria Ocasio-Cortez at 71%, Gavin Newsom at 70%, Pete Buttigieg at 66%, Josh Shapiro at 52%, and Andy Beshear at 46%.

The economy is the top issue for 34% of voters, up four points from the February national poll. Nineteen percent think threats to democracy is the top issue facing the U.S., down 11 points from February, followed by immigration (13%), healthcare (9%), crime (6%), education (4%), and foreign policy (4%).
Nearly half of likely voters (49%) rate the job President Trump is doing at handling foreign policy as “poor,” while 10% rate it as “fair,” 18% “good,” and 24% “excellent.”
Fifty-three percent of likely voters think the Trump administration is not “putting America first,” while 42% think it is. This is a reversal since March 2025, when 48% said the administration was putting “America first,” and 41% said it was not.
“Independent and Hispanic voters drive the shift in voters’ perception of the Trump administration,” Kimball said. “A year ago, independents were split: 45% thought the administration was putting America first and 44% thought it was not. Today, 58% say it is not, while 36% say it is. Similarly, Hispanics were split, 41% to 42%; today, 58% say the administration is not putting America first, while 33% say it is.”
- Half of men (50%) think the Trump administration is putting America first, while 45% think it is not. A majority of women (60%) think it is not putting America first, while 35% think it is.
A majority of likely voters, 88%, are closely following the situation in Iran, while 12% are not following the situation too closely. A plurality, 47%, oppose the U.S. military action in Iran, while 40% support it and 13% percent are unsure.
Voters were asked how likely they think it is that a world war breaks out in the next four years: 63% think it is somewhat or very likely, while 37% think it is not too likely or not at all likely. Opinion on the likelihood of an imminent world war shifted since March 2025, when 55% of respondents thought it was likely, and 45% thought it was unlikely.
- Results vary by age: 75% of voters under 50 think it is likely a world war breaks out in the next four years, compared to 54% of voters over the age of 50.
Methodology
The Emerson College Polling national survey was conducted March 16-17, 2026. The overall sample of US likely voters, n=1,000, has a credibility interval, similar to a poll’s margin of error (MOE), of +/- 3 percent. The data sets were weighted by gender, education, race, age, party registration, and region based on U.S. Census parameters and voter file data.
It is important to remember that subsets based on demographics, such as gender, age, education, and race/ethnicity, carry with them higher credibility intervals, as the sample size is reduced. Survey results should be understood within the poll’s range of scores, and with a confidence interval of 95% a poll will fall outside the range of scores 1 in 20 times.
Data was collected by contacting an online panel of voters provided by Consensus Strategies using MMS text-to-web, with additional panel interviews provided by PureSpectrum. Panel responses were matched to the Aristotle voter file using respondents’ full name and ZIP code. The survey was offered in English.
All questions asked in this survey with exact wording and order, along with full results, demographics, and cross tabulations can be found below.


