

Rep. Elissa Slotkin With Early Lead Over Republican Candidates for US Senate Seat
A new Emerson College Polling survey of Michigan voters finds President Joe Biden with a 43% job approval, while half (50%) of voters disapprove of the job he is doing in the Oval Office. Governor Gretchen Whitmer has a 49% job approval, while 43% disapprove of the job she is doing as Governor.
Spencer Kimball, Executive Director of Emerson College Polling, said, “Just over half of independent voters, 51%, disapprove of the job Biden is doing in office. This is a pivotal group in Michigan that Biden won over in 2020 yet is struggling with both nationally and statewide in recent surveys.”
BIDEN AND TRUMP LEAD PRESIDENTIAL PRIMARIES
In the 2024 Democratic Primary, 65% of Democratic primary voters plan to support Biden for the Democratic nomination, while 11% support Robert Kennedy Jr., and 5% support Marianne Williamson. Seventeen percent are undecided.
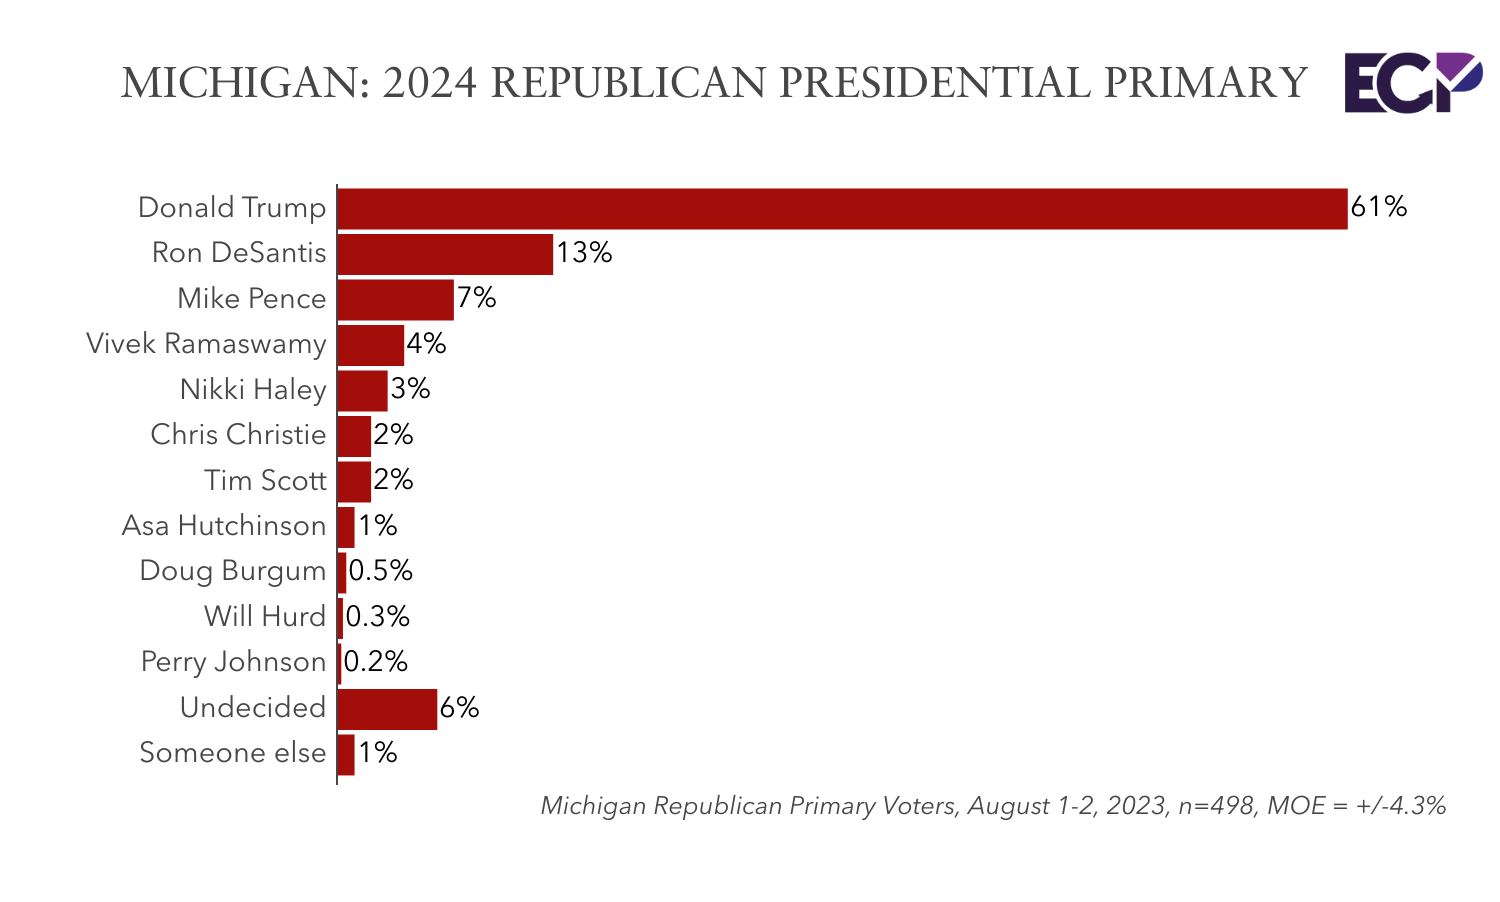
Sixty-one percent (61%) of Republican Primary voters plan to support former President Donald Trump for the 2024 nomination. Thirteen percent support Florida Governor Ron DeSantis, 7% former Vice President Mike Pence, 4% entrepreneur Vivek Ramaswamy, 3% former US Ambassador to the UN and South Carolina Governor Nikki Haley, and 2% support Senator Tim Scott. Six percent are undecided.
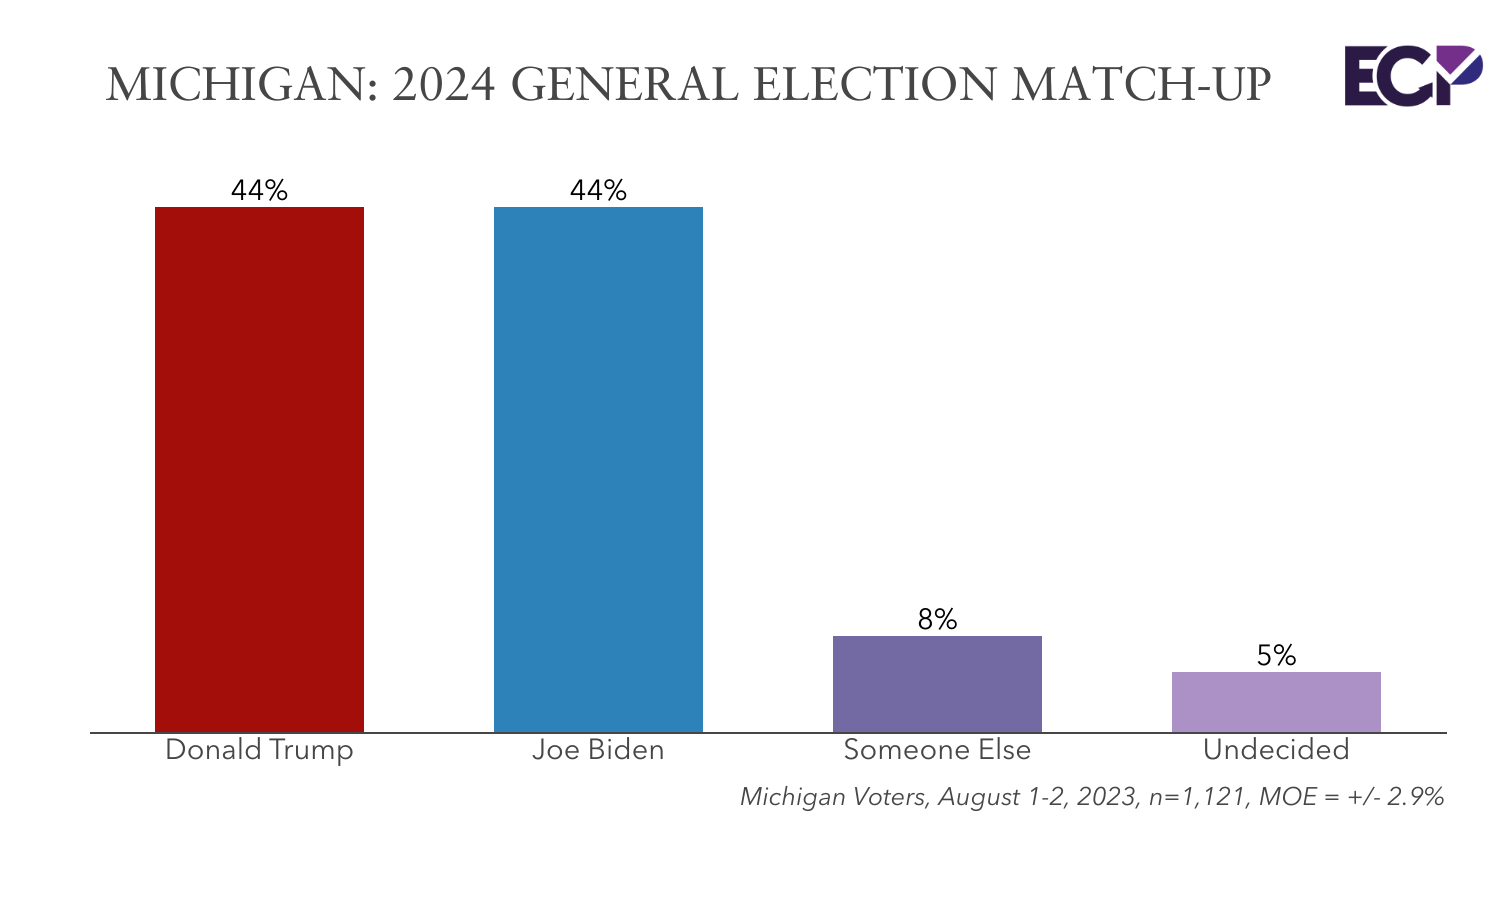
A hypothetical 2024 Presidential match-up between President Biden and former President Trump is statistically even, each candidate receives 44%. Eight percent would vote for someone else and 5% are undecided.
When Green Party candidate Cornel West is added to the ballot, Trump receives 43%, Biden 41%, West 4%, and 4% support someone else. Seven percent are undecided upon West’s addition to the ballot test.
ELISSA SLOTKIN HOLDS PLURALITY SUPPORT AMONG DEMOCRATS, NO FRONTRUNNER FOR REPUBLICANS
A plurality of Democratic Primary voters plan to support Rep. Elissa Slotkin for the Democratic nomination for Senate, while 8% support Actor Hill Harper. Twenty-five percent are undecided, and 22% say they would support someone else.
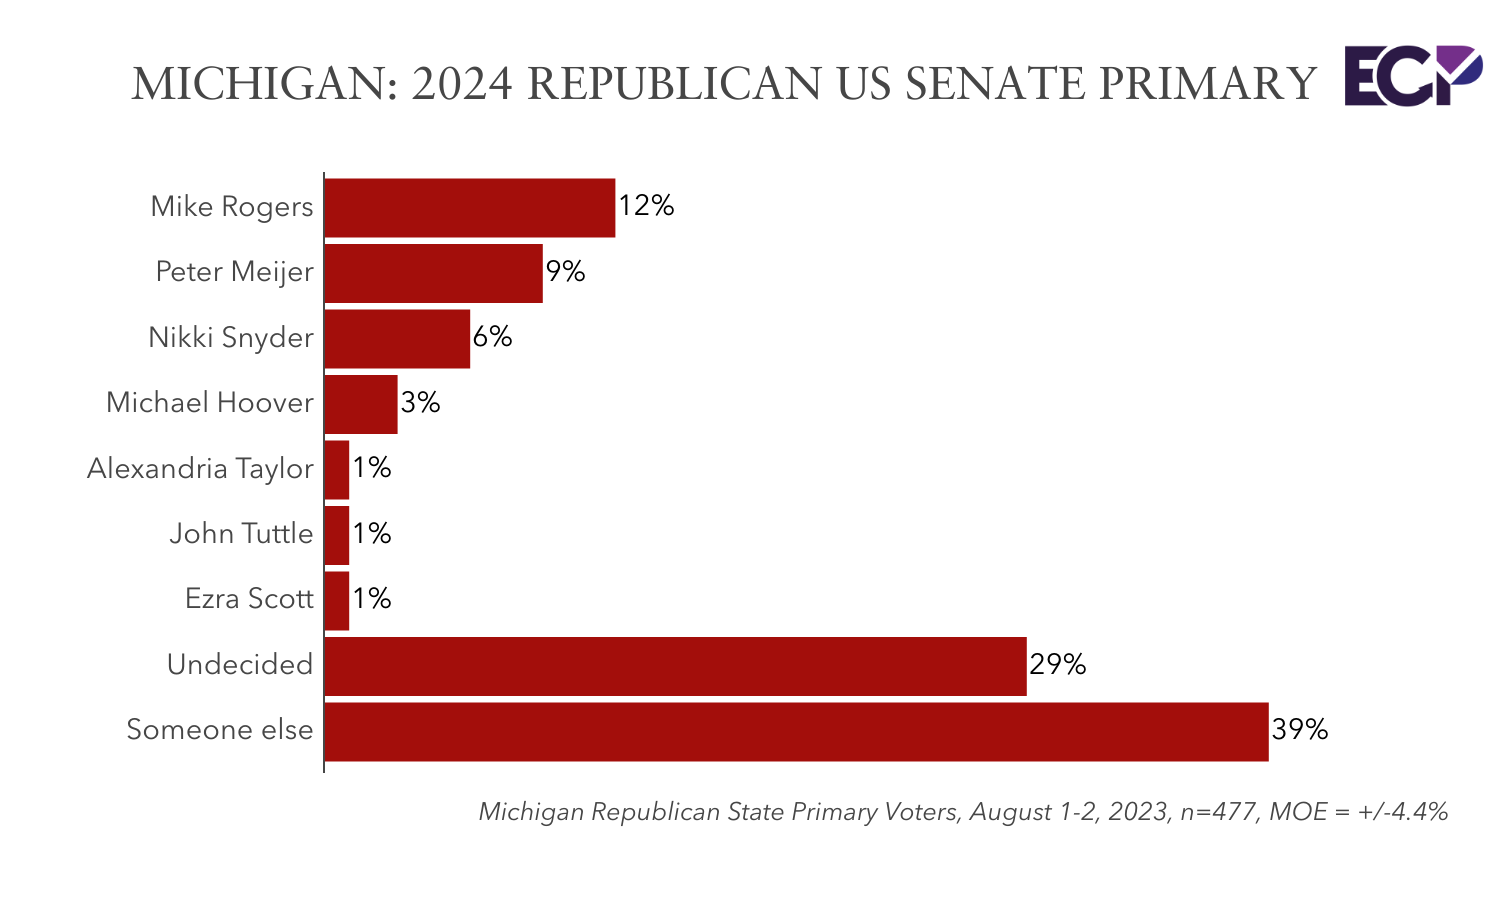
In the Republican Senate Primary, 68% are either undecided (29%) or would vote for someone other than the candidates listed. The only candidate with double digit support is former Rep. Mike Rogers with 12%.
“There is room for change in both the Democratic and Republican Senate primaries. While Slotkin is in the most favorable position among Democrats, she still does not hold a majority.” Kimball said. “The 47% of voters who are undecided or say they will vote for someone else reflects room for this race to change. The Republican Primary appears wide open, with no clear leader and 68% of voters choosing someone else/undecided.”
In a series of hypothetical trial heats between Democratic Rep. Slotkin and Michigan Republicans, Slotkin leads former Rep. Peter Meijer 42% to 36%, Nikki Snyder 44% to 36%, and John Tuttle 45% to 35%. James Craig who has not announced was included and trailed 45% to 38%.
Michigan voters are split on what date they prefer the primary be held on: 25% prefer March 12, 2024, while 21% prefer February 27, 2024. A majority, 54%, are unsure or have no opinion.
As the National Popular Vote Interstate Compact Initiative is a potential 2024 ballot measure, voters were asked which approach to presidential elections they prefer, continuing to use the electoral college, or change the a national popular vote. Forty-seven percent think it should be changed to a popular vote, while 40% think the U.S. should continue to use the electoral college.
“Democrats support a change to a national popular vote over the electoral college, 59% to 28%. Half of Republicans would like to continue to use the electoral college, while 35% support a change to a popular vote.” Kimball said. “Interestingly, there was no partisan difference found on when the Michigan Presidential primary should be held.”
MICHIGAN VOTERS SPLIT ON TOP ISSUES
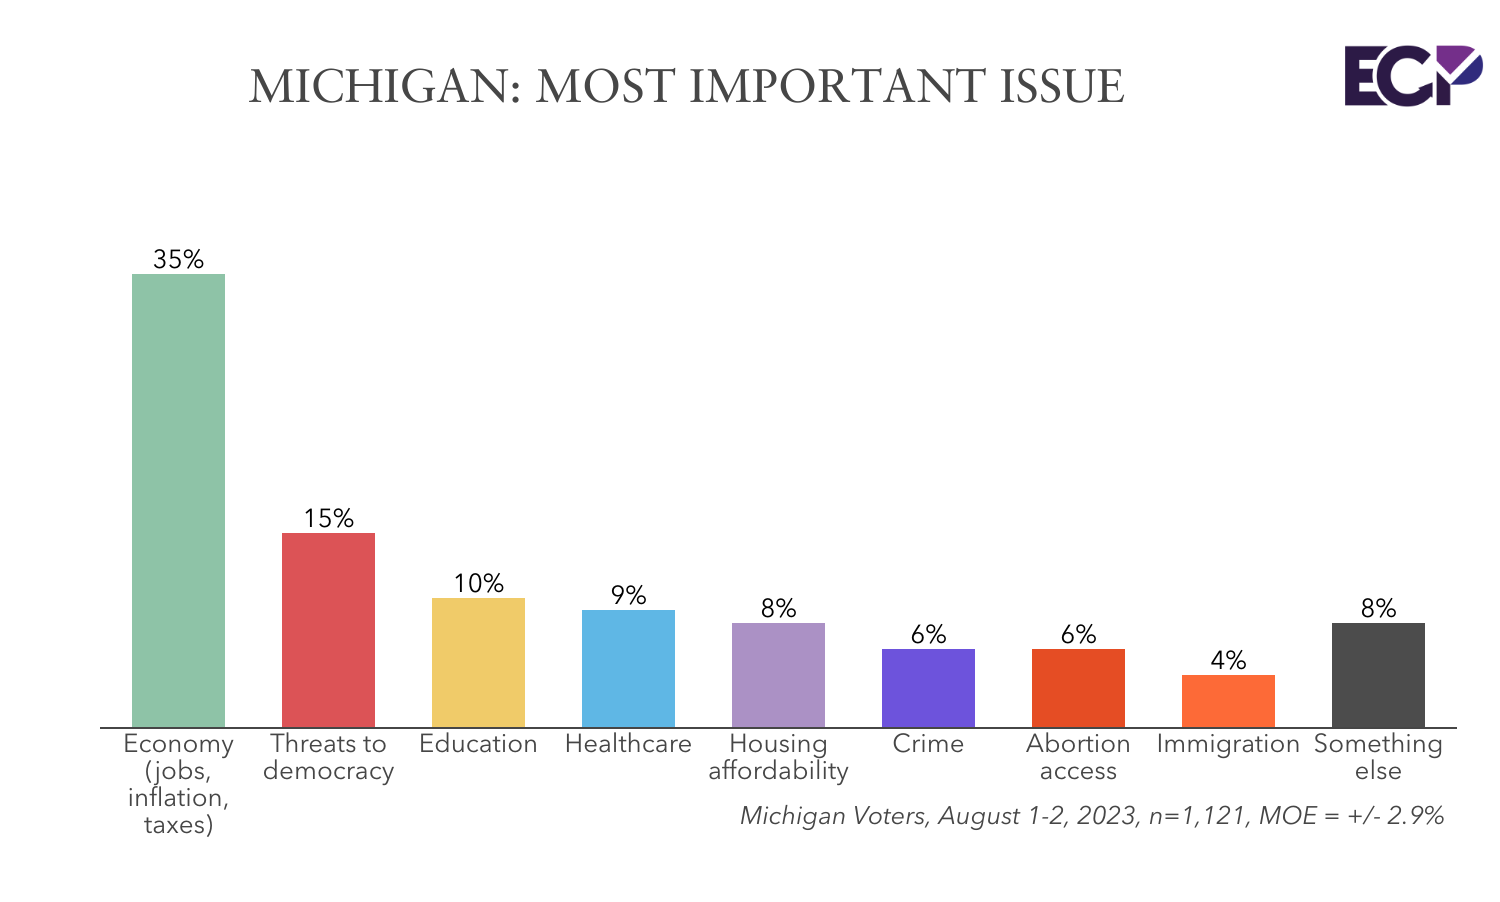
The economy is a concern for voters in Michigan, with 35% picking the economy as the most important issue facing the state. Threats to Democracy (15%), education (10%), healthcare (9%), and housing affordability (8%) round out the top issues for voters in Michigan.
Younger voters are more concerned about housing affordability than older voters: 21% find it to be their top concern, twice as much as any other age group.
Michigan voters are also split on what they see as the greatest threat to U.S. elections. Voter fraud (38%) and suppression of individuals from voting (28%) are viewed as the greatest threats to elections, followed by foreign interference (11%) and voting machines malfunctioning (6%). Eleven percent of voters say there are no threats facing U.S. elections.
There is a significant split between Republican and Democratic voters in Michigan on the greatest threat to U.S. elections; 45% of Democrats say voter suppression poses the greatest threat to elections, while a majority (58%) of Republicans say voter fraud is the greatest threat to elections.
FELLOW SPOTLIGHT
This summer, Emerson College Polling held an undergraduate research fellowship program. Three students joined the ECP research team and were immersed in the survey research process.
Maggie Wille (Class of 2024) chose to study Michigan as part of her fellowship experience alongside Emerson College Polling staff. She has been tracking and studying US Senate races as a fellow. She notes, “Over a year out from the 2024 Elections, Representative Elissa Slotkin leads against potential GOP candidates. While it’s far out, she performs strongest among women voters, a key demographic for democrats to hold onto Stabenow’s senate seat.”
METHODOLOGY
The Emerson College Polling Michigan survey was conducted August 1-2, 2023. The sample of registered voters, n=1,121, has a credibility interval, similar to a poll’s margin of error (MOE), of +/- 2.9 percentage points. The data sets were weighted by gender, education, race, age, party affiliation, and region based on 2024 registration modeling. Modeling is based on US Census parameters and Michigan voter registration and election data.
It is important to remember that subsets based on demographics, such as gender, age, education, and race/ethnicity, carry with them higher credibility intervals, as the sample size is reduced. Survey results should be understood within the poll’s range of scores, and understand with a confidence interval of 95% a poll will fall outside the range of scores 1 in 20 times.
Data was collected by contacting an Interactive Voice Response (IVR) system of landlines, an online panel of voters, and cellphones via SMS-to-web, and a consumer list of emails.
All questions asked in this survey with exact wording, along with full results and cross tabulations can be found here. This survey was funded by Emerson College.


