

Haley Outperforms Trump and DeSantis Against Biden Among New Hampshire Voters
A new Emerson College Polling/WHDH poll of New Hampshire voters finds former President Donald Trump with 49% of voters’ support in the 2024 Republican Primary, consistent with his support in August. Unlike the August survey, a candidate reaches double digits this month: Nikki Haley, whose support increased 14 percentage points, from 4% in August to 18% this November. Former New Jersey Governor Chris Christie follows with 9%, consistent with his August support, followed by Florida Governor Ron DeSantis, at 7%, a one-point decrease since the summer poll. Vivek Ramaswamy holds 5%, followed by the South Carolina Senator who is no longer in the running, Tim Scott, at 2%, and North Dakota Governor Doug Burgum at 2%. Nine percent of voters are undecided.
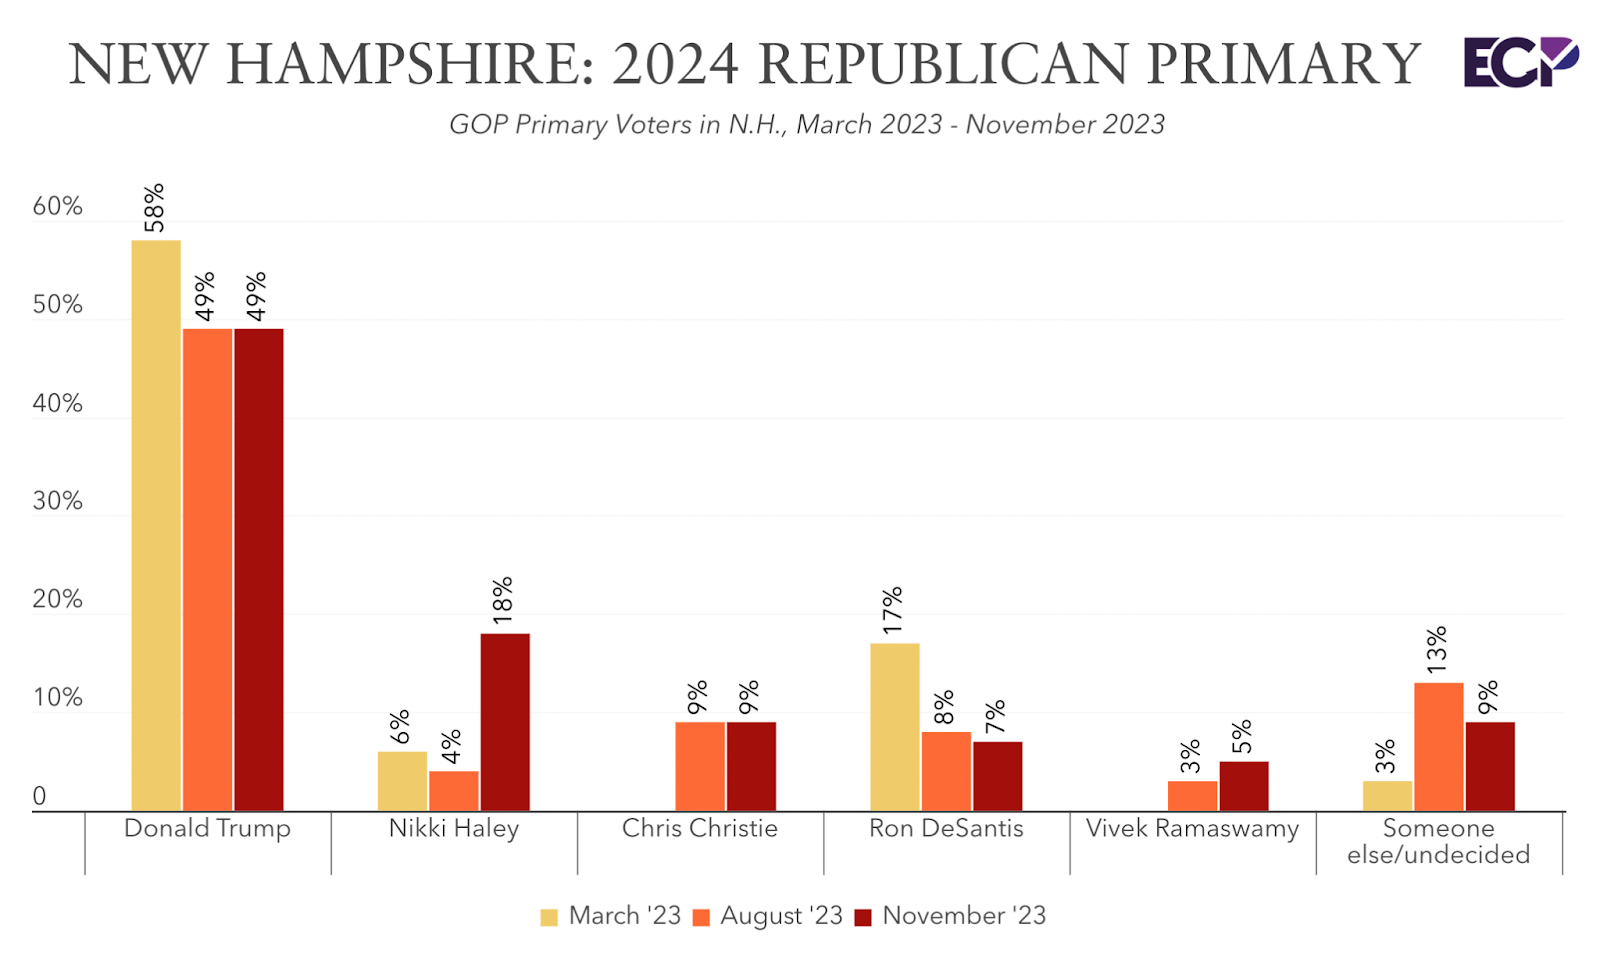
“Nikki Haley’s support is driven by older voters, and those with postgraduate degrees,” Spencer Kimball, Executive Director of Emerson College Polling, said. “While Trump leads across all age groups, Haley gets 21% of the vote from voters over 40 while getting about 8% from voters under 40”. Kimball also points out that “Trump leads among non-college-educated with 57% to 12% for Haley, but among college-educated GOP voters Trump leads 35% to 27%, and among those with postgraduate degrees Trump leads 29% to 26% over Haley.”
Republican primary voters were also asked to name their second-choice candidate in the race; 22% selected Ron DeSantis, 18% chose Nikki Haley, and 15% selected Vivek Ramaswamy.
In the Democratic Primary, voters were presented with candidates Marianne Williamson, Dean Phillips, or a “someone else” option, where they could write in or vocalize which candidate they planned on voting for. A plurality of Democratic Primary voters (44%) are undecided, while 27% plan to write in Joe Biden, 15% plan to vote for Dean Phillips, 10% for Marianne Williamson, and 5% for someone else.
Kimball notes, “As Biden is not officially on the ballot in New Hampshire, Democratic Primary voters appear to be confused on which candidate to support and how to vote for them.”
In a 2024 hypothetical presidential match-up between Biden and Trump, Biden leads 47% to 42%, while 12% are undecided. Trump voters were asked if they would still vote for Trump if he is convicted in a criminal trial: 80% still will support him, 5% will not, and 15% are unsure. In a matchup between Biden, Trump, Robert Kennedy Jr., and Cornel West, the race appears to tighten with 40% supporting Biden, 37% supporting Trump, 8% supporting Kennedy Jr., and 1% supporting West. Fourteen percent are undecided.
- Kennedy supporters equally come from both Trump and Biden, 6% of Biden and Trump voters switch to Kennedy when he is added to the ballot; 26% of those who are undecided on a Trump v. Biden match-up support Kennedy when he is added to the ballot.
“Kennedy voters are significantly less locked in than Biden and Trump voters,” Kimball explained: “Majorities of Biden and Trump voters, 66% and 68%, say they will definitely vote for the candidate they chose, whereas 75% of Kennedy voters say there is a chance they could change their mind and vote for someone else.”
Other hypothetical Republican and Democratic candidates in New Hampshire were tested against Biden and Trump.
Between Biden and Nikki Haley, Haley leads 45% to 39%, with 17% undecided. Between Biden and DeSantis, Biden leads 46% to 38%, with 17% undecided.
“Independent New Hampshire voters prefer Biden against Trump, 47% to 36%, DeSantis, 46% to 31%, however, they are more split with Haley on the ballot, breaking for Haley over Biden, 40% to 38%,” Kimball noted.
Between Trump and Massachusetts Senator Elizabeth Warren, Warren leads 45% to 43%, with 12% undecided. Between Vermont Senator Bernie Sanders and Donald Trump, Sanders leads 48% to 43%, with 10% undecided.
Voters were asked if they see Biden’s age as making the job too difficult to do the work the presidency requires, or if it helps him have the experience to do a good job as president: 53% think Biden’s age makes the job too difficult while 23% think his age helps his experience in the role; 24% think it does not matter.
- Those who see Biden’s age as making the job too difficult is highest among voters under 30 at 63%. This decreases to 56% among voters in their 30s, 52% among voters in their 40s, 55% among voters in their 50s, 47% among voters in their 60s, and 46% among voters over 70.
- Still, a quarter of those who say age makes his job too difficult still plan to vote for Biden over Trump, while 61% of those who say Biden’s age makes his job too difficult plan to vote for Trump. 9 in 10 voters who view his age as contributing to his experience to do the job plan to vote for Biden, and a slight majority (52%) of those who do not think his age matters plan to vote for Biden, 34% for Trump, and 14% are undecided.
President Biden holds a 37% approval among New Hampshire voters, while 53% disapprove of the job he is doing in office. A majority of voters (58%) consider the Biden administration’s foreign policy to be more of a failure rather than a success, while 42% view it as more of a success rather than a failure. Regarding the Biden administration’s immigration policy, 66% view it as more of a failure, while 34% consider it to be more of a success.
In a hypothetical gubernatorial election between Republican Kelly Ayotte and Democrat Joyce Craig, Ayotte leads 43% to 40%, with 17% undecided. In a match-up between Ayotte and Democrat Cinde Warmington, Ayotte leads 44% to 37%, with 19% undecided.
New Hampshire voters find the economy to be the most important issue facing the state at 36%, followed by housing affordability (23%), “threats to democracy” (11%), abortion access (6%), education (6%), immigration (5%), and crime (3%).
METHODOLOGY
The Emerson College Polling/WHDH New Hampshire survey was conducted November 10-13, 2023. The sample of registered voters, n=917, has a credibility interval, similar to a poll’s margin of error (MOE), of +/- 3.3 percentage points. The data sets were weighted by gender, education, age, party registration, and region based on 2024 registration modeling. Modeling is based on U.S. Census parameters and New Hampshire voter registration and election data.
It is important to remember that subsets based on demographics, such as gender, age, education, and race/ethnicity, carry with them higher credibility intervals, as the sample size is reduced. Survey results should be understood within the poll’s range of scores, and understand with a confidence interval of 95% a poll will fall outside the range of scores 1 in 20 times.
Data was collected by contacting an Interactive Voice Response (IVR) system of landlines (n=313), an online panel of voters (n=462), and a consumer list of emails (n=142).
All questions asked in this survey with exact wording, along with full results and cross tabulations can be found here. This survey was sponsored by WHDH.


