

Trump 46%, Biden 43%
A new Emerson College Polling national survey finds 46% of voters support former President Donald Trump, 43% support President Joe Biden, and 12% are undecided in the November presidential election. Since Emerson’s last national poll in early April, support for Biden lowered by two points, while Trump maintained 46%. When undecided voters are asked which candidate they lean toward, Trump’s overall support increases to 51%, and Biden to 48%.
Seventy-five percent of voters think the cost of living in the United States is rising, 18% think it is staying the same, and 7% think the cost is easing.

“Voters who think the cost of living is rising support Trump over Biden, 56% to 32%,” Spencer Kimball, executive director of Emerson College Polling, said. “Those who feel the cost of living is easing or staying the same support Biden over Trump, 94% to 6% and 67% to 18%.”
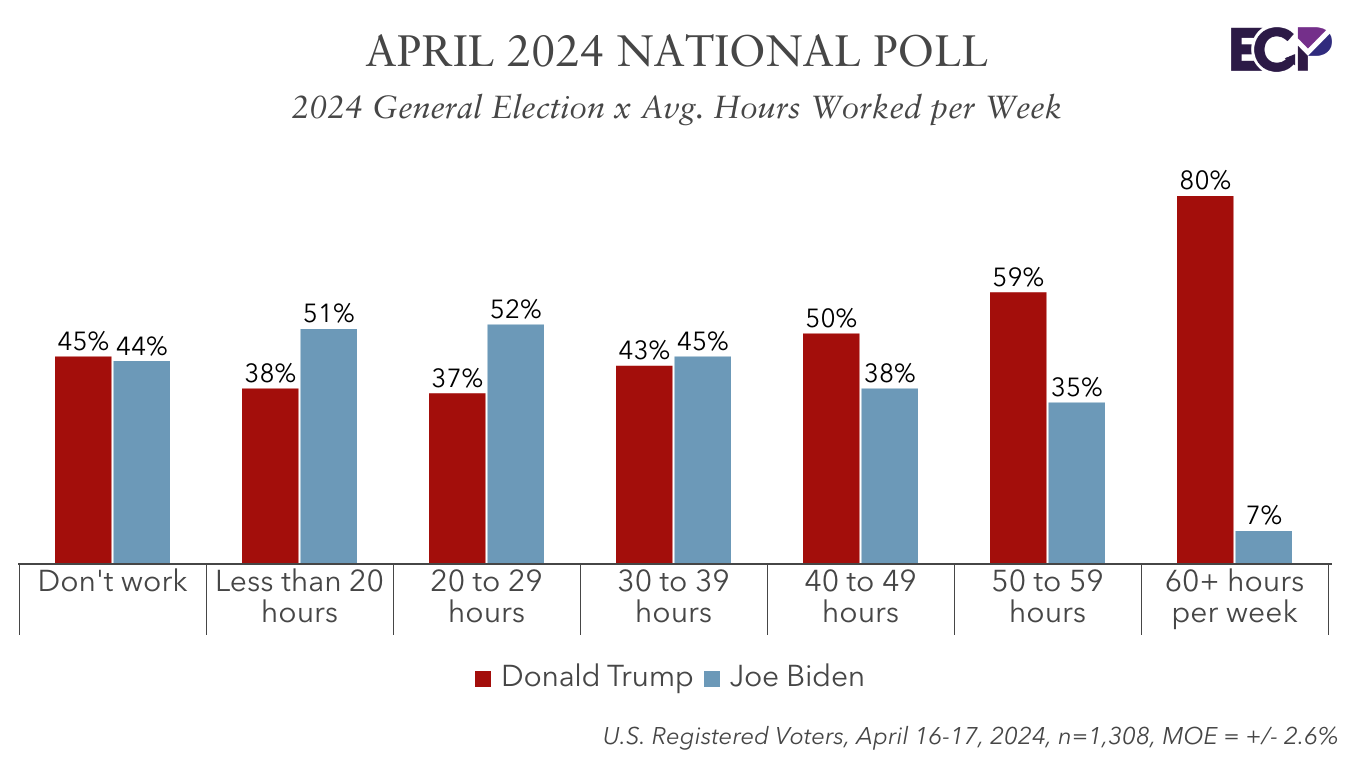
Analysis of voter work hours reveals distinct candidate preferences. Non-workers are evenly split: 45% support Trump, 44% Biden. Those working 30 hours or less favor Biden over Trump (52% to 37%), while those in the 30-40 hour bracket are divided (45% Biden, 43% Trump). Trump gains support among those working 40-60 hours, with increasing margins as hours increase, peaking at 80% for those working over 60 hours, compared to 7% for Biden.
On a ballot test including independent candidates, 44% support Trump, 40% Biden, 8% Robert Kennedy Jr., and 1% Cornel West; 8% are undecided.
- Kennedy Jr. has the support of 13% of independent voters, 12% of voters under 30, and 9% of Black voters.
In a hypothetical ballot test for the 2024 U.S. congressional elections, a generic congressional Democrat and Republican are tied at 45%, while 11% are undecided.
- Among undecided voters in the presidential election, 31% support the Democratic congressional candidate, and 19% the Republican; 50% are undecided in the generic congressional election.
The economy is the top issue for 36% of voters, followed by immigration at 21%, threats to democracy at 10%, healthcare at 9%, abortion access at 7%, and crime at 6%.
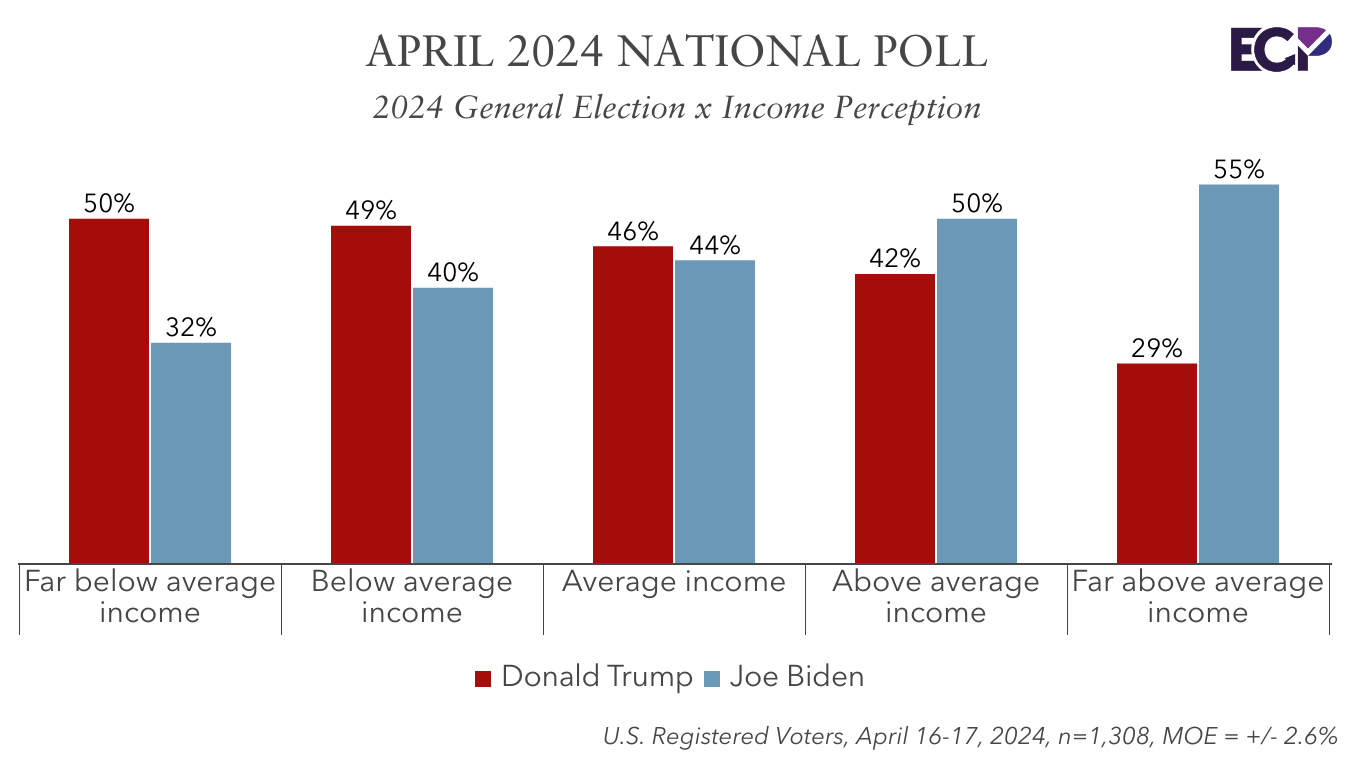
Compared with American families in general, 44% of voters think their family income is average, while 38% think it is below average, and 18% think their family income is above average.
Kimball added: “Income perception aligns with candidate preference, with those feeling their income is far below average favoring Trump 50% to 32% and those feeling it’s far above average favoring Biden 55% to 29%.”
A plurality of voters (44%) think they are not getting an accurate picture of how the war is going in Israel and Gaza, while 25% think they are, and 31% are not sure.
“Perceptions of receiving accurate war information show a significant split,” Kimball noted. “Biden leads among those who think they are getting accurate information (53% to 36%), while Trump leads among skeptics (53% to 38%). Those unsure are divided, with 44% leaning toward Trump and 42% toward Biden.”
Forty-one percent of voters think Israel should retaliate against Iran for Iran’s missile attack, while 28% think they should not, and 31% are not sure.
“There’s a clear division in candidate preference based on opinions about Israel’s response to Iran’s missile strikes, with Trump being favored by those in favor of retaliation, 66% to 25% while those who favor no retaliation break for Biden, 67% to 23%,” Kimball said.
- There is a significant gender divide on the topic: 51% of men think Israel should retaliate compared to 32% of women who say the same. Twenty-six percent of men think they should not retaliate compared to 30% of women.
Despite ongoing discussion regarding the cost of a college education, the highest education correlates with higher incomes, with postgraduates reporting the highest income, 26% earning over $150,000.
Methodology
The Emerson College Polling national survey was conducted April 16-17, 2024. The sample of registered voters, n=1,308, has a credibility interval, similar to a poll’s margin of error (MOE), of +/- 2.6 percentage points. The data sets were weighted by gender, education, race, age, party affiliation, and region based on 2024 registration modeling. Turnout modeling is based on U.S. Census parameters, and voter registration data.
It is important to remember that subsets based on demographics, such as gender, age, education, and race/ethnicity, carry with them higher credibility intervals, as the sample size is reduced. Survey results should be understood within the poll’s range of scores, and with a confidence interval of 95% a poll will fall outside the range of scores 1 in 20 times.
Data was collected by contacting an Interactive Voice Response (IVR) system of landlines (provided by Aristotle), and an online panel of voters provided by CINT. The survey was offered in English.
All questions asked in this survey with exact wording, along with full results, demographics, and cross tabulations can be found under Full Results. This survey was funded by Emerson College.


