
Majority (57%) think ICE’s presence in communities is more harmful than beneficial
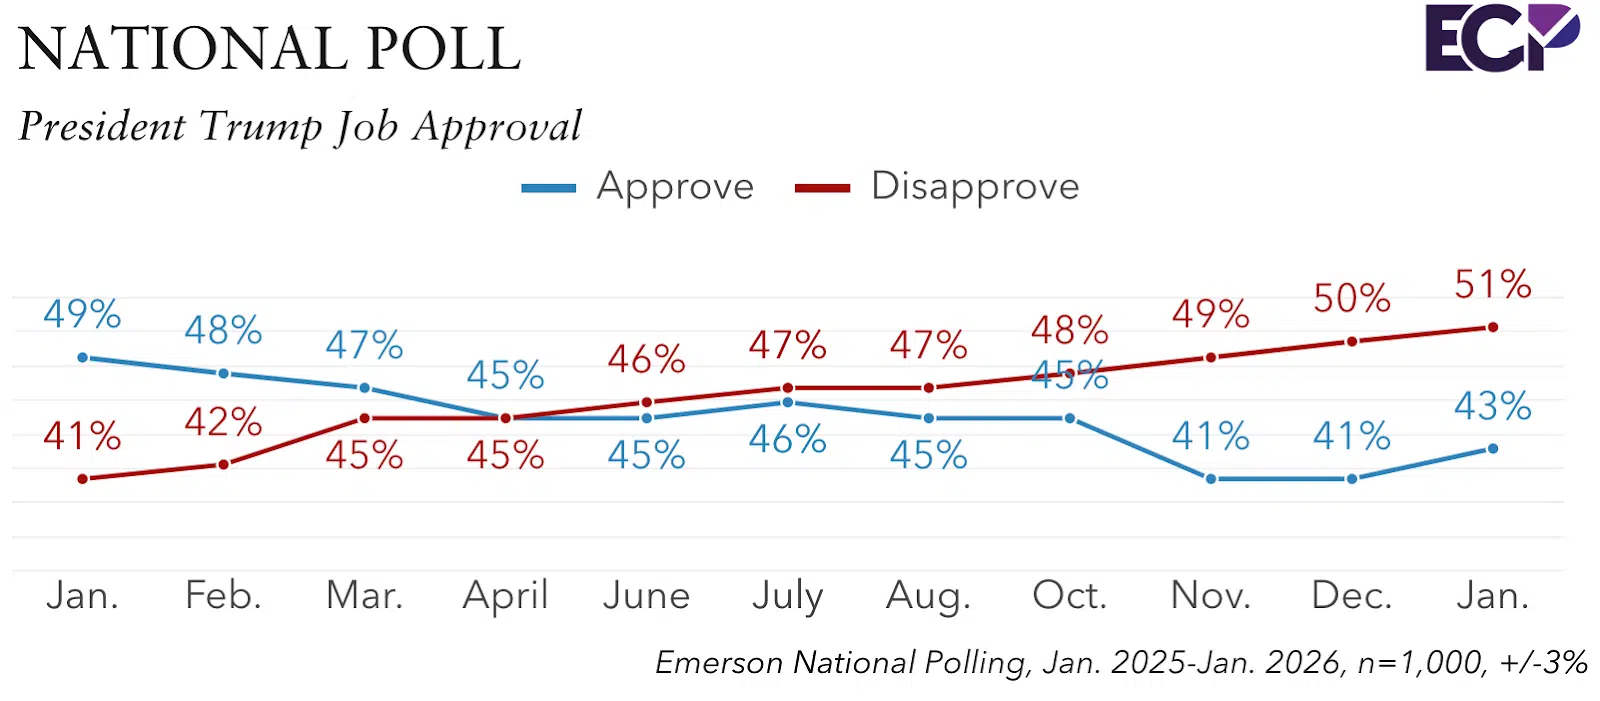
A new Emerson College Polling national survey finds 43% of likely voters approve of the job President Trump is doing in office, while 51% disapprove one year into the administration. Looking ahead to the November 2026 Midterm Elections, 48% support the Democratic candidate on the generic congressional ballot and 42% plan on voting for the Republican candidate.
“About 9 in 10 Democrats and Republicans plan on voting for their respective party’s congressional candidate, whereas independents break for the Democratic candidate, 50% to 28%,” Spencer Kimball, executive director of Emerson College Polling, said. “There is a clear gender divide on the congressional ballot: women break for the Democratic candidate 53% to 38%, while 47% of men support the Republican and 42% the Democrat.”
Voters were asked if they have a favorable or unfavorable view of several officials in the federal government. Federal Reserve Chair Jerome Powell holds the highest net favorability at +18 points, while Secretary of Homeland Security Kristi Noem and Secretary of War Pete Hegseth have the lowest net favorability at -7 and -6, respectively.

Fifty-seven percent of voters think ICE’s presence in communities has been more harmful than beneficial, while 38% think it has been more beneficial than harmful. Five percent think it has had no impact.
“A majority of Hispanic voters, 55%, think ICE’s presence in communities has been more harmful than helpful, along with 82% of Black voters and 51% of white voters,” Kimball noted.
A plurality of voters (46%) disapprove of the Trump administration’s actions in Venezuela, while 39% approve of the actions.
“Venezuela is the Trump administration’s top issue in the survey among Hispanic voters, who approve of the administration’s actions 44% to 37%, while Black voters disapprove 72% to 18%. White voters are split: 43% approve and 42% disapprove,” Kimball noted.
Voters oppose the United States adding Greenland as a US territory 50% to 28%, while 22% are unsure. Voters were asked the same question on Greenland nearly a year ago in February, 2025: opposition to the US acquiring Greenland increased from 44% to 50%, and support decreased by two points, from 30% to 28%.
A majority of voters (56%) think the country is on the wrong track, while 44% think it is headed in the right direction. Since late January 2025, those who think the country is heading in the right direction decreased from 52% to 44%, and those who think it is on the wrong track increased from 48% to 56%.
A plurality of voters, 39%, said their finances are worse off than a year ago. Thirty-one percent said their finances are about the same as a year ago, and 30% are better off financially than a year ago.
Voters were asked which better describes their current financial situation: living paycheck to paycheck or living comfortably. Half of voters report living paycheck to paycheck, while 50% report living comfortably.
Of those living paycheck to paycheck, 64% think the country is on the wrong track, while 36% think it is headed in the right direction. Of those living comfortably, 51% think the country is headed in the right direction, and 49% think it is on the wrong track.
Majorities of those under 50 report living paycheck to paycheck (59% to 41%), while majorities of those over 50 report living comfortably (58% to 42%).
Methodology
The Emerson College Polling national survey was conducted January 17-19, 2026. The overall sample of US likely voters, n=1,000, has a credibility interval, similar to a poll’s margin of error (MOE), of +/- 3 percentage points. The data sets were weighted by gender, education, race, age, party registration, and region based on U.S. Census parameters and voter file data.
It is important to remember that subsets based on demographics, such as gender, age, education, and race/ethnicity, carry with them higher credibility intervals, as the sample size is reduced. Survey results should be understood within the poll’s range of scores, and with a confidence interval of 95% a poll will fall outside the range of scores 1 in 20 times.
Data was collected by contacting an online panel of voters provided by Commonwealth Opinions Panel using MMS text-to-web, with additional panel interviews provided by PureSpectrum. Panel responses were matched to the Aristotle voter file using respondents’ full name and ZIP code. The survey was offered in English.
All questions asked in this survey with exact wording and order, along with full results, demographics, and cross tabulations can be found below.


